Recently Published
Function to find NA
The goal of this tutorial is to automatise the process of finding NAs in columns.
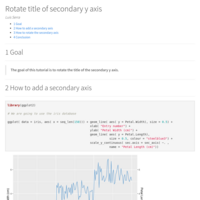
Rotate secondary y axis
The goal of this tutorial is to rotate the title of the secondary y axis.
How to show numbers without exponents
The goal of this tutorial is to show numbers without exponents. If we work with large numbers and we want to see every single cypher.
How to install tensorflow in R
The goal of this tutorial is to install tensorflow properly in our system to use it in R
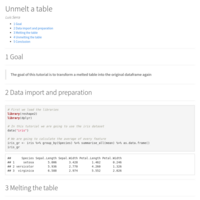
Unmelt a table
The goal of this tutorial is to transform a melted table into the original dataframe again
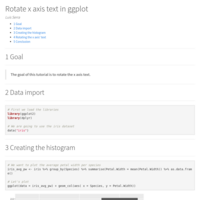
Rotate x axis text in ggplot
The goal of this tutorial is to rotate the x axis text. This could be useful for example when we want to plot dates and the text in the axis overlap.
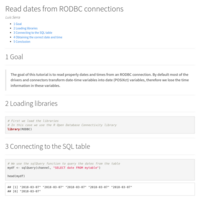
Read dates from RODBC connections
The goal of this tutorial is to read properly dates and times from an RODBC connection. By default most of the drivers and connectors transform date-time variables into date (POSIXct) variables, therefore we lose the time information in these variables.
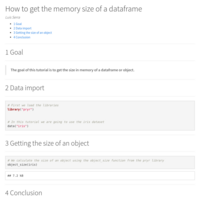
How to get the memory size of a dataframe
The goal of this tutorial is to get the size in memory of a dataframe or object.
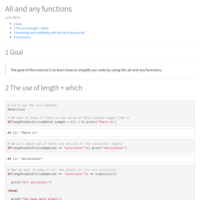
All and any functions
The goal of this tutorial is to learn how to simplify our code by using the all and any functions.
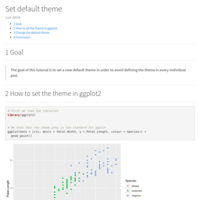
Set default theme
The goal of this tutorial is to set a new default theme in order to avoid defining the theme in every individual plot.
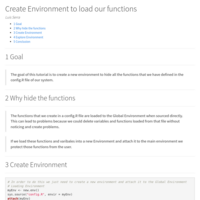
Create Environment to load our functions
The goal of this tutorial is to create a new environment to hide all the functions that we have defined in the config.R file of our system.
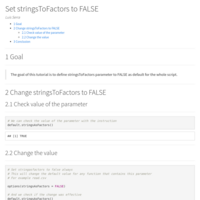
Set stringsToFactors to FALSE
The goal of this tutorial is to define stringsToFactors parameter to FALSE as default for the whole script.
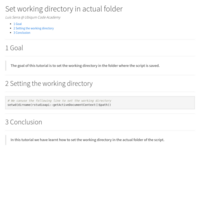
Set working directory in actual folder
The goal of this tutorial is to set the working directory in the folder where the script is saved.
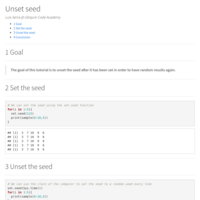
Unset seed
The goal of this tutorial is to unset the seed after it has been set in order to have random results again.
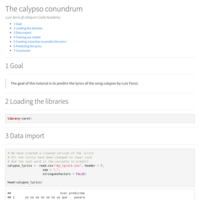
The calypso conundrum
The goal of this tutorial is to predict the lyrics of the song calypso by Luis Fonsi.
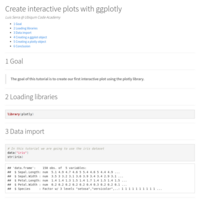
Create interactive plots with ggplotly
The goal of this tutorial is to create our first interactive plot using the plotly library.
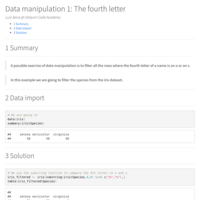
Data Manipulation 1: The fourth letter
A possible exercise of data manipulation is to filter all the rows where the fourth letter of a name is an o or an s.
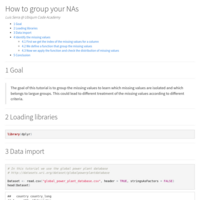
How to group your NAs
The goal of this tutorial is to group the missing values to learn which missing values are isolated and which belongs to largue groups. This could lead to different treatment of the missing values according to different criteria.
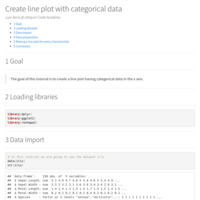
Create line plot with categorical data
The goal of this tutorial is to create a line plot having categorical data in the x axis.
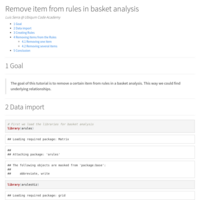
Remove item from rules in basket analysis
The goal of this tutorial is to remove a certain item from rules in a basket analysis. This way we could find underlying relationships.
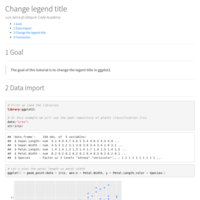
Change legend title
The goal of this tutorial is to change the legent title in ggplot2.
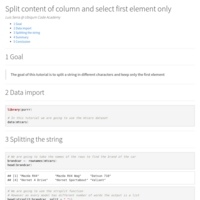
Split content of column and select first element only
The goal of this tutorial is to split a string in different characters and keep only the first element
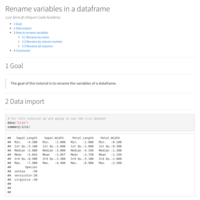
Rename variables in a dataframe
The goal of this tutorial is to rename the variables of a dataframe.
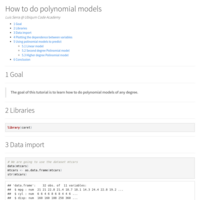
How to do polynomial models
The goal of this tutorial is to learn how to do polynomial models of any degree.
LinkedIn studies 3: At what time does people get connected
We want to check year by year how is the time distribution for LinkedIn connections. Overnight connections might indicate overseas links.
LinkedIn studies 2: When will I reach the limit of 30k connections
LinkedIn has a limit of 30.000 connections so I want to know using a time series analysis when I will reach that limit.
TuneGrid and TuneLength in Caret
The goal of this tutorial is to learn how to use the two parameters from caret package: TuneGrid and TuneLength.
How to clean the entire environment
The goal of this tutorial is to clean the environment to check that there is no clash between variables. This instruction can be written at the beginning of a script for safety.
How to write footnotes on markdown
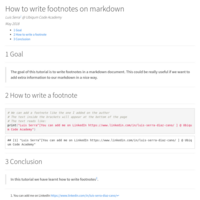
The goal of this tutorial is to write footnotes in a markdown document. This could be really useful if we want to add extra information to our markdown in a nice way.
How to create an html notebook
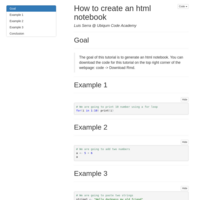
The goal of this tutorial is to generate an html notebook. You can download the code for this tutorial on the top right corner of the webpage: code -> Download Rmd.
LinkedIn studies 1: Find HR people in my connections
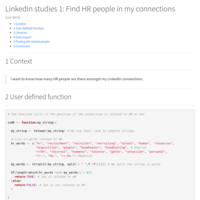
I want to know how many HR people are there amongst my LinkedIn connections.
Saving and reading a model from file
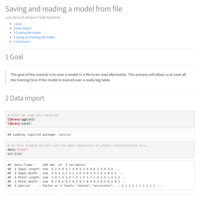
The goal of this tutorial is to save a model in a file to be read afterwards. This process will allow us to save all the training time if the model is trained over a really big table.
Define the breaks in a plot
The goal of this tutorial is to learn how to define the breaks in a geom point plot in ggplot.
Plot time series as ggplot objects: autoplot
The goal of this tutorial is to plot time series and forecast objects as ggplot plots that can be later customized using the ggplot grammar.
The pipe operator
The goal of this tutorial is to learn the basics and how to use the pipe operator.
Time series linear model: tslm
The goal of this tutorial is to learn how to use the time series linear model.
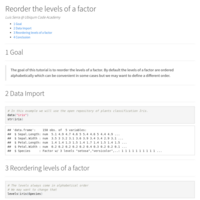
Reorder the levels of a factor
The goal of this tutorial is to reorder the levels of a factor. By default the levels of a factor are ordered alphabetically which can be convinient in some cases but we may want to define a different order.
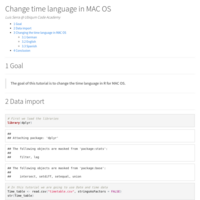
Change time language in MAC OS
The goal of this tutorial is to change the time language in R for MAC OS.
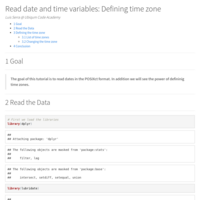
Read date and time variables: Defining time zone
The goal of this tutorial is to read dates in the POSIXct format. In addition we will see the power of defining time zones.
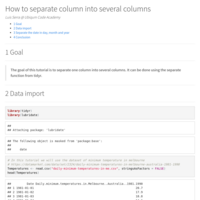
How to separate column into several columns
The goal of this tutorial is to separate one column into several columns. It can be done using the separate function from tidyr.
How to read topological data
The goal of this tutorial is to read and plot topological data from .bil files. There are many free sites to get this kind of data and could be useful to learn how to deal with this filetype.
Define default values for parameters in a function
The goal of this tutorial is to learn how to define default values for parameters in a handmade function.
Melting a table: melt function
The goal of this tutorial is to learn how to melt a table. The process of melting consists of transforming a table with different variables in a table where the columns are melted into variable and value. We can define which columns to use as ids and the rest will be melted.
Remove empty transaction tickets
The goal of this tutorial is to remove empty tickets from a transaction file. Sometimes we could load empty lines at the end of a file and we may need to get rid of them.
Plot a decision tree
The goal of this tutorial is to be able to visualize a decision tree in order to get information and insights from it.
Load several libraries at once
The goal of this tutorial is to load several libraries in one single action. This could be very useful for example if we can define a common list of libraries for a project. We could even load the list of libraries from a source file.
Find missing values in factor variable
The goal of this tutorial is to find missing values in a factor variable.
Center the title in ggplot
The goal of this tutorial is to center the title of a plot in ggplot.
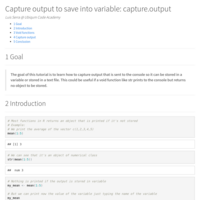
Capture output to save into variable: capture.output
The goal of this tutorial is to learn how to capture output that is sent to the console so it can be stored in a variable or stored in a text file. This could be useful if a void function like str prints to the console but returns no object to be stored.
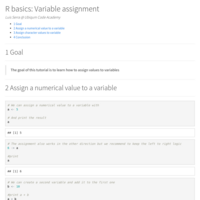
R basics: Variable assignment
The goal of this tutorial is to learn how to assign values to variables
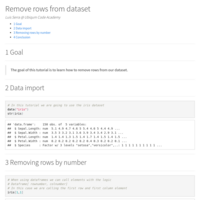
Remove rows from dataset
The goal of this tutorial is to learn how to remove rows from our dataset.
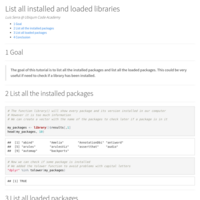
List all installed and loaded libraries
The goal of this tutorial is to list all the installed packages and list all the loaded packages. This could be very useful if need to check if a library has been installed.
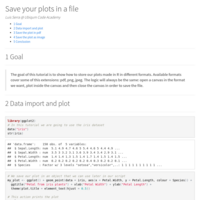
Save your plots in a file
The goal of this tutorial is to show how to store our plots made in R in different formats. Available formats cover some of this extensions: pdf, png, jpeg. The logic will always be the same: open a canvas in the format we want, plot inside the canvas and then close the canvas in order to save the file.
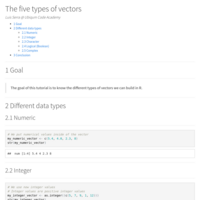
The five types of vectors
The goal of this tutorial is to know the different types of vectors we can build in R.
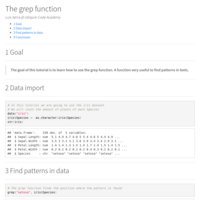
How to find patterns in data: Grep
The goal of this tutorial is to learn how to use the grep function. A function very useful to find patterns in texts.
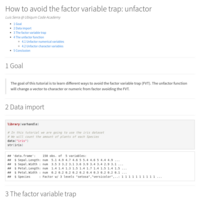
How to avoid the factor variable trap: unfactor
The goal of this tutorial is to learn different ways to avoid the factor variable trap (FVT). The unfactor function will change a vector to character or numeric from factor avoiding the FVT.
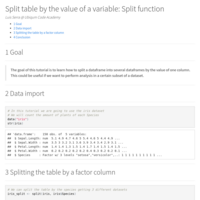
Split table by the value of a variable: Split function
The goal of this tutorial is to learn how to split a dataframe into several dataframes by the value of one column. This could be useful if we want to perform analysis in a certain subset of a dataset.
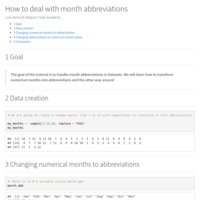
How to deal with month abbreviations
The goal of this tutorial is to handle month abbreviations in Datasets. We will learn how to transform numerical months into abbreviations and the other way around
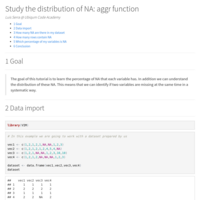
Study the distribution of NA: aggr function
The goal of this tutorial is to learn the percentage of NA that each variable has. In addition we can understand the distribution of these NA. This means that we can identify if two variables are missing at the same time in a systematic way.
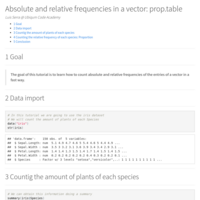
Absolute and relative frequencies in a vector: prop.table
The goal of this tutorial is to learn how to count absolute and relative frequencies of the entries of a vector in a fast way.
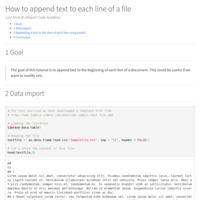
How to append text to each line of a file
The goal of this tutorial is to append text to the beginning of each line of a document. This could be useful if we want to modify urls.
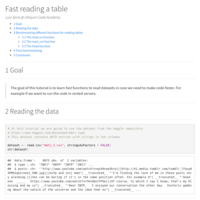
Fast reading a table
The goal of this tutorial is to learn fast functions to read datasets in case we need to make code faster. For example if we want to run the code in rented servers.
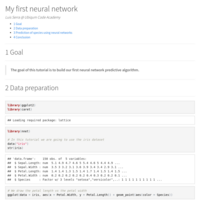
My first neural network
The goal of this tutorial is to build our first neural network predictive algorithm.
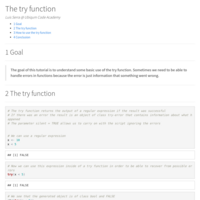
The try function
The goal of this tutorial is to understand some basic use of the try function. Sometimes we need to be able to handle errors in functions because the error is just information that something went wrong.
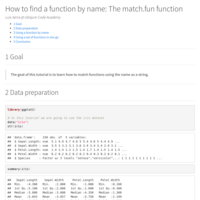
How to find a function by name: The match.fun function
The goal of this tutorial is to learn how to match functions using the name as a string.
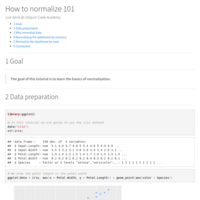
How to normalize 101
The goal of this tutorial is to learn the basics of normalization.
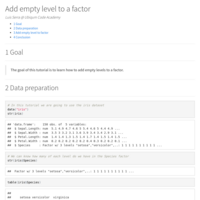
Add empty level to a factor
The goal of this tutorial is to learn how to add empty levels to a factor.
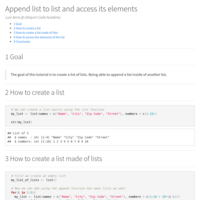
Append list to list and access its elements
The goal of this tutorial is to create a list of lists. Been able to append a list inside of another list.
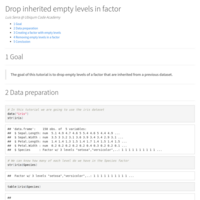
Drop inherited empty levels in factor
The goal of this tutorial is to drop empty levels of a factor that are inherited from a previous dataset.
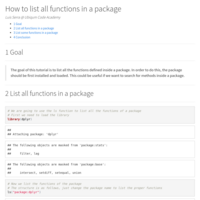
How to list all functions in a package
The goal of this tutorial is to list all the functions defined inside a package. In order to do this, the package should be first installed and loaded. This could be useful if we want to search for methods inside a package.
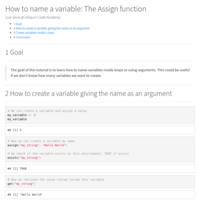
How to name a variable: The Assign function
The goal of this tutorial is to learn how to name variables inside loops or using arguments. This could be useful if we don't know how many variables we want to create.
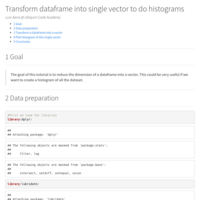
Transform dataframe into single vector to do histograms
The goal of this tutorial is to reduce the dimension of a dataframe into a vector. This could be very useful if we want to create a histogram of all the dataset.
ggplot: Add transparency to lines
The goal of this tutorial is to learn how to add transparency to lines in ggplot in order to best see lines that are on top of each other.
The Print function
The goal of this tutorial is to learn the basics about the print function
Get path and create variable
The goal of this tutorial is to avoid writing by hand a path if we want to use data from different folders in the same script. In this example we will recreate the case of reading 3 tables from three different folders.
Apply family of functions
The goal of this tutorial is to get familiar with the apply family of functions using typical examples.
Find columns without variance
The goal of this tutorial is to learn how to find which columns of our dataset with zero variance and remove them from the dataset in order to perform certain analysis.
ggplot: Facet grid
The goal of this tutorial is to learn how to use the facet grid function on ggplot. The idea is to create a different plot for different values of a categorical variable.
Add linear model to data points
The goal of this tutorial is to learn how to draw a linear model on top of a scatter plot using stat smooth in ggplot. This can be very useful when we want to see quickly the linear trends in our data.
ggthemes: Extra themes for ggplot
The goal of this tutorial is to show a sample of complete themes contained in the ggthemes library. For default themes check the default themes tutorial.
Add third variable to geom point
The goal of this tutorial is to learn different ways to introduce a third variable in a scatter plot in ggplot using shape, colour and size in geom_point.
Complete themes in ggplot
The goal of this tutorial is to show a sample of complete themes that can be used to customize plots in order to use them in presentations or reports. We can change the colours of the plot by defining a theme rather than changing everything by hand.
ggplot: How to stack and draw geom col
The goal of this tutorial is to learn the different configurations of column plot in ggplot.
ggplot: Draw a different line per year
The goal of this tutorial is to learn how to properly define a table in order to draw a different line per year when plotting a variable per month.
Remove elements from ggplot
The goal of this tutorial is to learn how to remove all elements from a plot with ggplot. This could be useful if we want to produce a plot with certain characteristics.
How to build a time series with different period size
The goal of this tutorial is to learn how to build properly time series not based on years but on different time periods.
Select rules with one specific product
The goal of this tutorial is to read the rules containing one specific product on the right or left side of the rule.
Fun with flags Chapter 2: Set ggplot palette with Scandinavian flags
The goal of this tutorial is to learn the use of the scale_colour_manual function of ggplot. We will draw different scandinavian flags for this purpose. We will define a different colour palette for each country.
Fun with flags Chapter 1: How different algorithms see the Japanese flag
The goal of this tutorial is to see how different algorithms work on a 2D canvas. For this example we are going to use the Japanese flag because it is symmetrical. We will try to predict a missing part of the flag as well as doing the standard train-test separation to learn how different algorithms see the flag.
Keep only numerical columns
The goal of this tutorial is to keep only numerical columns of a dataframe. This is useful when using sum function on aggregate or group_by functions because it returns errors when non-numerical columns are present.
How to build a time series
The goal of this tutorial is to learn how to build properly a time series in order to prepare data to do forecasting and all sort of time related predictions.
Transpose Dataframe
The goal of this tutorial is to learn how to transpose a dataframe. We will show two different ways to do it.
SetSeed function
The goal of this tutorial is to understand the use of the SetSeed function and key concepts like random number generation with R.
Group by function
The goal of this tutorial is to use the group_by function to create datasets grouped by a defined variable.
Read date and time variables: How to create tags
The goal of this tutorial is to read dates in the POSIXct format. In addition we will learn how to create labels for different uses.
Read csv tutorial
The goal of this tutorial is to understand the different parameters that can help us when we read a csv file.
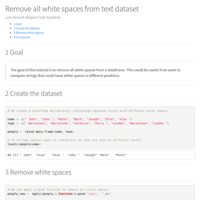
Remove all white spaces from text dataset
The goal of this tutorial is to remove all white spaces from a dataframe. This could be useful if we want to compare strings that could have white spaces in different positions.
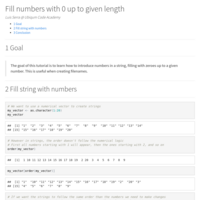
Fill numbers with 0 up to given length
The goal of this tutorial is to learn how to introduce numbers in a string, filling with zeroes up to a given number. This is useful when creating filenames.
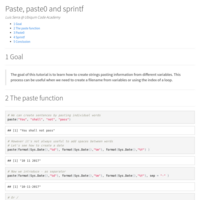
Paste, paste0 and sprintf
The goal of this tutorial is to learn how to create strings pasting information from different variables. This process can be useful when we need to create a filename from variables or using the index of a loop.
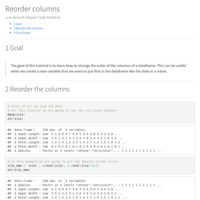
Reorder columns
The goal of this tutorial is to learn how to change the order of the columns of a dataframe. This can be useful when we create a new variable that we want to put first in the dataframe like the date or a name.
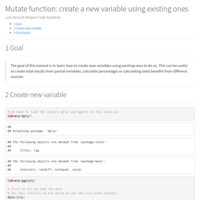
Mutate function: create a new variable using existing ones
The goal of this tutorial is to learn how to create new variables using existing ones to do so. This can be useful to create total results from partial variables, calculate percentages or calculating total benefits from different sources.
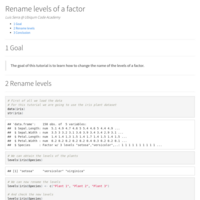
Rename levels of a factor
The goal of this tutorial is to learn how to change the name of the levels of a factor.
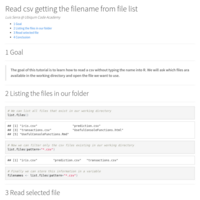
Read csv getting the filename from file list
The goal of this tutorial is to learn how to read a csv without typing the name into R. We will ask which files ara available in the working directory and open the file we want to use.
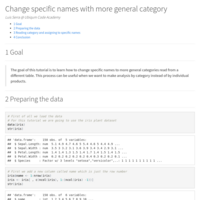
Change specific names with more general category
The goal of this tutorial is to learn how to change specific names to more general categories read from a different table. This process can be useful when we want to make analysis by category instead of by individual products.
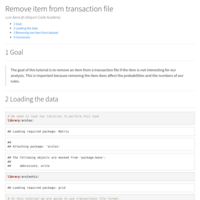
Remove item from transaction file
The goal of this tutorial is to remove an item from a transaction file if the item is not interesting for our analysis. This is important because removing the item does affect the probabilities and the numbers of our rules.
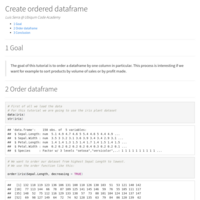
Create ordered dataframe
The goal of this tutorial is to order a dataframe by one column in particular. This process is interesting if we want for example to sort products by volume of sales or by profit made.
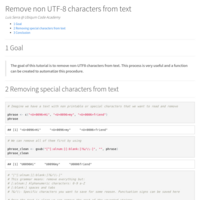
Remove non UTF-8 characters from text
The goal of this tutorial is to remove non-UTF8 characters from text. This process is very useful and a function can be created to automatize this procedure.
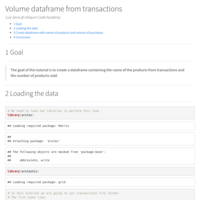
Volume dataframe from transactions
The goal of this tutorial is to create a dataframe containing the name of the products from transactions and the number of products sold.
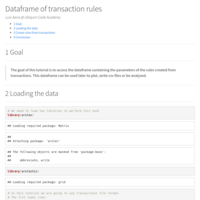
Dataframe of transaction rules
The goal of this tutorial is to access the dataframe containing the parameters of the rules created from transactions. This dataframe can be used later to plot, write csv files or be analysed.
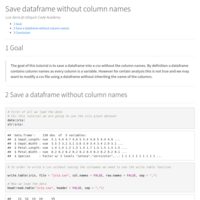
Save dataframe without column names
The goal of this tutorial is to save a dataframe into a csv without the column names. By definition a dataframe contains column names as every column is a variable. However for certain analysis this is not true and we may want to modify a csv file using a dataframe without inheriting the name of the columns.
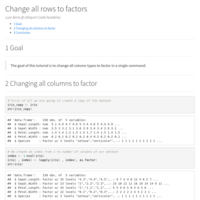
Change all rows to factors
The goal of this tutorial is to change all column types to factor in a single command.
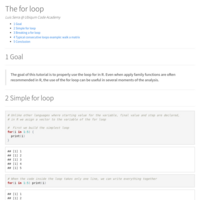
The for loop
The goal of this tutorial is to properly use the loop for in R. Even when apply family functions are often recommended in R, the use of the for loop can be useful in several moments of the analysis.
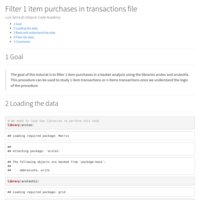
Filter 1 item purchases in transactions file
The goal of this tutorial is to filter 1 item purchases in a basket analysis using the libraries arules and arulesViz. This procedure can be used to study 1 item transactions or n items transactions once we understand the logic of the procedure.
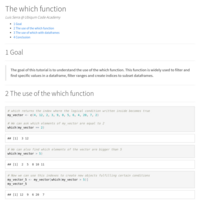
The which function
The goal of this tutorial is to understand the use of the which function. This function is widely used to filter and find specific values in a dataframe, filter ranges and create indices to subset dataframes.
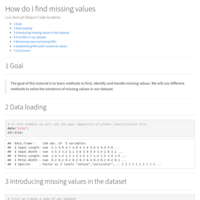
How do I find missing values
The goal of this tutorial is to learn methods to find, identify and handle missing values. We will use different methods to solve the existence of missing values in our dataset.
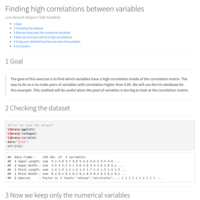
Finding high correlations between variables
The goal of this exercise is to find which variables have a high correlation inside of the correlation matrix. The way to do so is to make pairs of variables with correlation higher than 0.85. We will use the iris database for this example. This method will be useful when the pool of variables is too big to look at the correlation matrix.
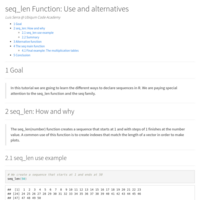
seq_len Function: Use and alternatives
In this tutorial we are going to learn the different ways to declare sequences in R. We are paying special attention to the seq_len function and the seq family.
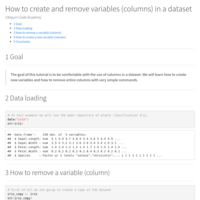
How to create and remove variables (columns) in a dataset
The goal of this tutorial is to be comfortable with the use of columns in a dataset. We will learn how to create new variables and how to remove entire columns with very simple commands.
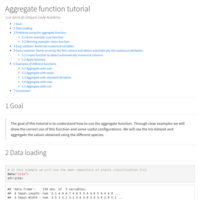
Aggregate function tutorial
The goal of this tutorial is to understand how to use the aggregate function. Through clear examples we will show the correct use of this function and some useful configurations. We will use the Iris dataset and aggregate the values obtained using the different species.
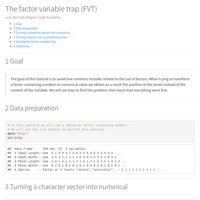
The factor variable trap (FVT)
The goal of this tutorial is to avoid one common mistake related to the use of factors. When trying to transform a factor containing numbers to numerical value we obtain as a result the position of the levels instead of the content of the variable. We will see how to find this problem and check that everything went fine.