
seslezak
Steven Slezak
Recently Published
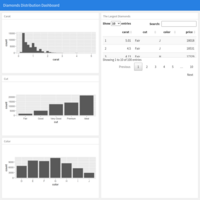
Dashboard Test
Test of RMarkdown FlexDashboard
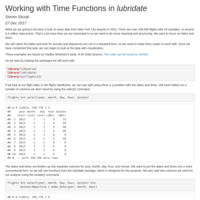
Time Functions
Learning to use time functions with data on flights in New York City.
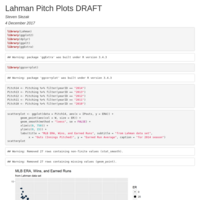
Lahman HR Plots
Series of visuals using HR data from the Lahman data set and ggplot2.
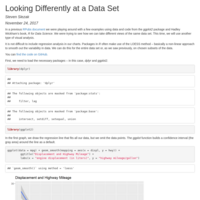
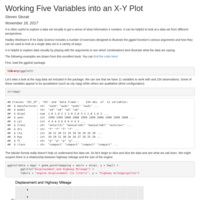
One Plot, Five Variables
It is possible to work a number of variables into a two-dimensional x-y plot in R.
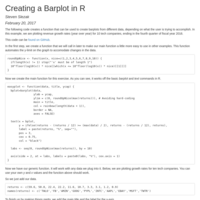
Growth Rate Barplot in R
The code and resulting graphic are presented for a barplot of the revenue growth rates for 10 major tech companies for the period ending in the fourth quarter of FY16.
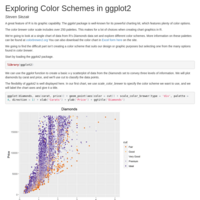
Exploring Color Schemes in ggplot2
Using ggplot2 to find the right palette of colors for a graph.
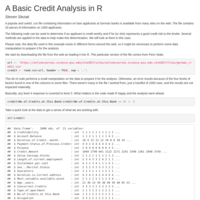
A Basic Credit Analysis in R
R is used to analyze characteristics of loan applicant to determine their creditworthiness.
Block Bootstrapping Method
An example of how to create a block bootstrap in R.
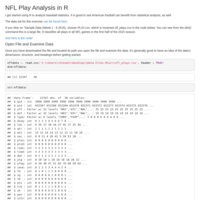
NFL Play Analysis
An analysis of passing and rushing plays in the NFL in 2015.

Automate Tasks Using ggplot2
End the drudgery of repetitive coding with a function.
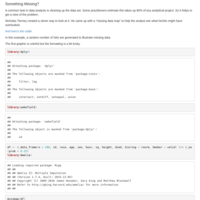
Missing Your Data?
An interesting way to visually depict the data missing in your data set.
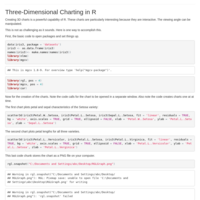
Three Dimensional Charting in R
There are powerful 3D tools in R.
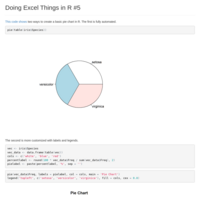
Doing Excel Things in R #5
Simple pie charts are as easy as, well, pie in Excel. And in R, too. D, too? Let me Luke into that and Chewbacca you on it.
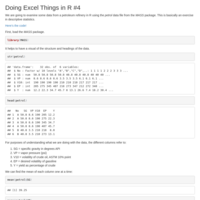
Doing Excel Things in R #4
Descriptive statistics are a strength of Excel. Here's how to do them in R.

Doing Excel Things in R #3
A few lessons in R to show how things can be done as they are in Excel.
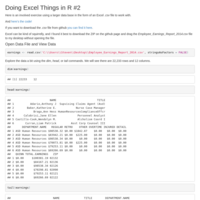
Doing Excel Things in R #2
Using a larger data file, some lessons in R for the Excel user.

Doing Excel Things in R #1
A few lessons useful in learning R for the Excel user.