
simeonem
Simeone Marino
Recently Published

CBDA Vignette version 1.0
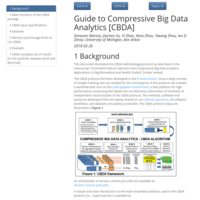
Guide to CBDA vignette for the version 1.0.0 of the CBDA R package.
CBDA Robustness test
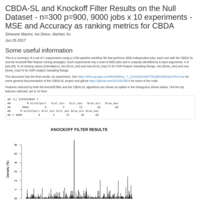
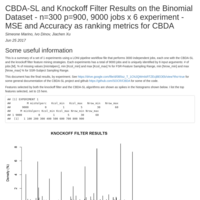
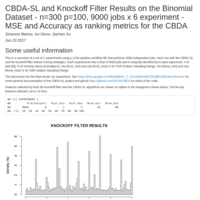
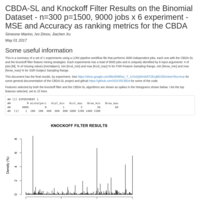
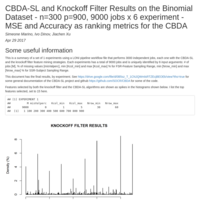
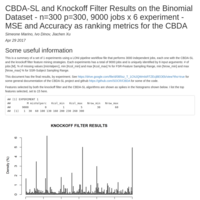
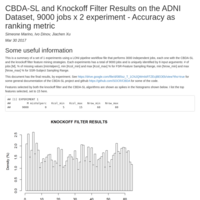
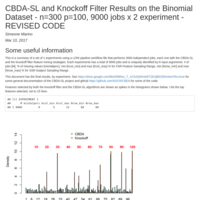
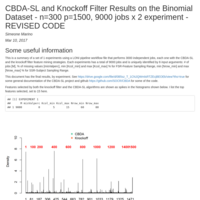
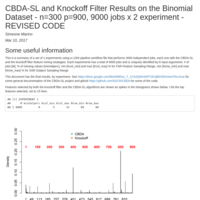
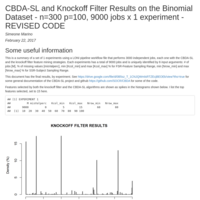
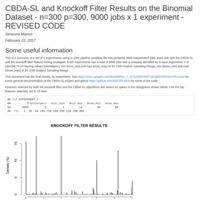
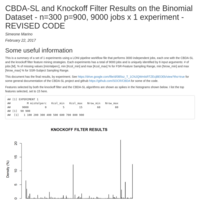
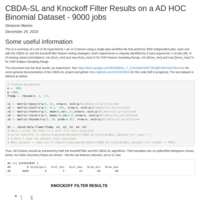
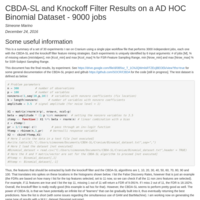
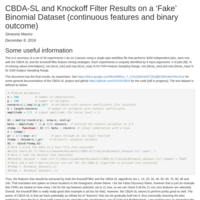
This is a summary of a set of 10 replications over a single experiment (i.e., experiment # 6 with the Binomial dataset 3) to test the CBDA-SL robustness.
The robustness of the CBDA-SL is shown by the consistent selection of similar top features across replications. Each replication has the same validation set for prediction purposes, but the CBDA-SL protocol is performed with diffrent seeds for each replication.

Results_Binomial_3_Combined
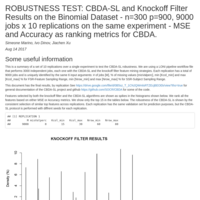
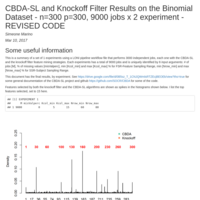
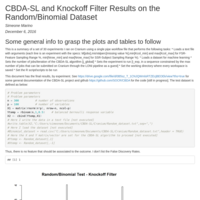
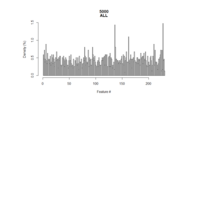
The last histograms combine all the experiments together to sift out the signal across all the different experimental designs for the CBDA and to compare with the Null dataset results.
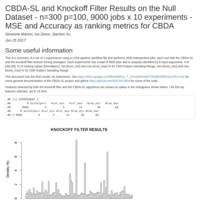
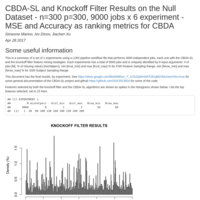
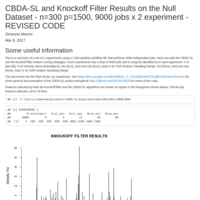
Null_final_9000_1000_10exps
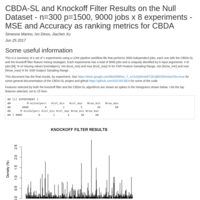
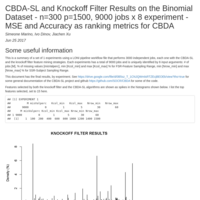
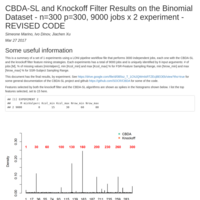
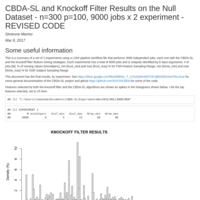
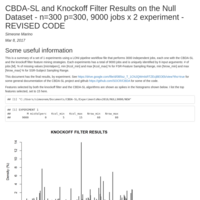
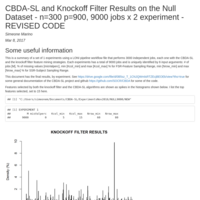
The final CBDA histogram generated with the MSE metric of combined results, show an almost flat distribution (i.e., no spikes/signals).
Despite the Null dataset has no signal in it, the KO filter algorithm returns few spikes (i.e., false positive). Similarly, the CBDA histogram generated
with the Accuracy metric returns some spikes (not matching the ones returned by the KO filter).
From the Binomial dataset analysis and from the results in Figure X, we concluded how the MSE metric is the most reliable to drive CBDA feature mining. Thus, the Null dataset analysis confirms no signal detection by the CBDA if we use the MSE metric.


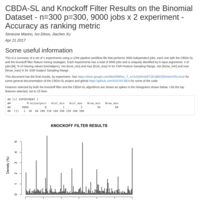


Binomial_dataset_Accuracy
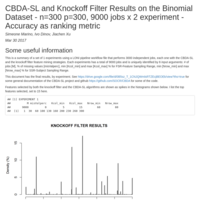
The ranking is done here by accuracy of each single prediction
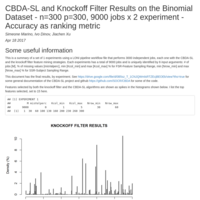
Binomial_dataset_MSE
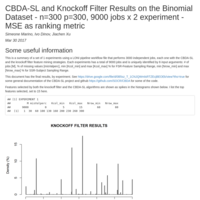
The ranking is done here by MSE


ABIDE classification (5 Experiments)
Two categories

ADNI classification 2 stages (MN4 & Binomial, 4 experiments)
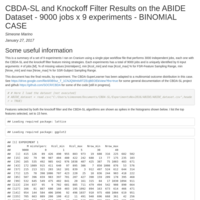
These are the results of classifying the ADNI patients as either Normal, LMCI, MCI or AD (4 categories). The features selected at the end of the analysis of the 4 Exps are then merged to the features selected at the end of the analysis of 9 experiments previously analyzed with a binomial set (e.g., AD vs Normal only). This 2 stages approach improves the AD class sensitivity, which is missed by using only a 1 stage approach with multinomial classification (see http://rpubs.com/simeonem/ADNI_MN4).

ADNI classification 2 stages (MN3 & Binomial, 6 experiments)
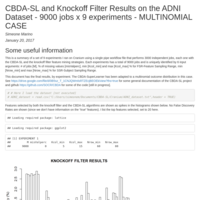
These are the results of classifying the ADNI patients as either Normal, MCI or AD. The groups MCI and LMCI are merged and labeled MCI (multinomial with 3 categories). The features selected at the end of the analysis of the Exp 1 are then merged to the features selected at the end of the analysis of 9 experiments previously analyzed with a binomial set (e.g., AD vs Normal only). This 2 stages approach greatly improves the AD class sensitivity, which is missed by using only a 1 stage approach with multinomial classification (see http://rpubs.com/simeonem/ADNI_MN3_Exp1-3-7-9).

ADNI MN4 + Binomial
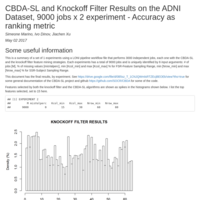
ADNI dataset classification results only on Experiment 1.
The methodology here is to:
[STAGE 1] run the full CBDA-SL (i.e., 9000 jobs) on Exp 1
[STAGE 2] run a single CBDA-SL job merging the features selected by STAGE 1 with the binomial stage Normal vs AD (i.e., 9000x9 total jobs, see http://rpubs.com/simeonem/ADNI_Confusion_Matrix for details).
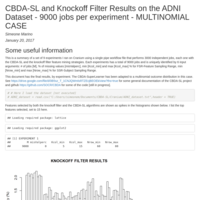
ADNI classification 1 stage - MN4
Multinomial classification with CBDA-SL with 4 categories on experiment 1

ADNI classification 2 stages
These are the results of classifying the ADNI patients as either Normal, MCI or AD. The groups MCI and LMCI are merged and labeled MCI (multinomial with 3 categories). The features selected at the end of the analysis of the Exp 1 are then merged to the features selected at the end of the analysis of 9 experiments previously analyzed with a binomial set (e.g., AD vs Normal only). This 2 stages approach greatly improves the AD class sensitivity, which is missed by using only a 1 stage approach with multinomial classification (see http://rpubs.com/simeonem/ADNI_MN3_exp1).
ADNI dataset - Multinomial Classification on Exp 1
This set of results is based only on Experiment 1. The strategy here is to merge the groups "LMCI" and "MCI" into one, to make it a multinomial with 3 categories (labeled as MN3).
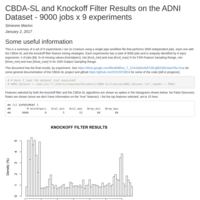
ADNI dataset results
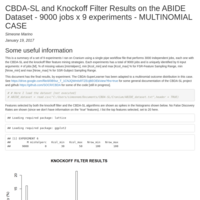
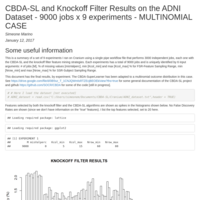
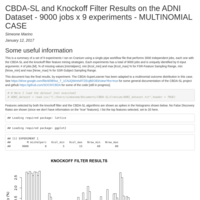
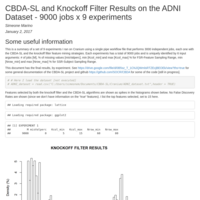
CBDA-SL and Knockoff filter results over 9 experiments. No Missing value input has been used (this is because it is a real dataset with some NA that will be filled by the missForest imputation algorithm.
The other specs are: i) SSR of 40-60%, 60-80% and 100%, ii) FSR of 5-15%, 15-30% and 30-50%. These specs make a total of 9 different experiments.
NULL dataset - 9000 jobs
Knockoff filter and CBDA-SL results on 12 experiments for a NULL dataset
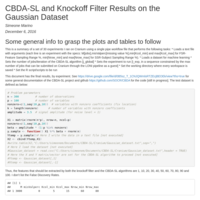
Gaussian dataset - CBDA-SL and Knockoff filter
Results on 30 experiments
Histograms CBDA-SL - first set of results
Absolute and relative frequency plots of 5 CBDA-SL experiments, each with 5000 iterations of the SuperLearner (SL) function. Dataset=MRI.
Each plot represents the occurrences of each feature across the top 20 predictions returned by the SL function.
The last 2 plots combine all the results in a single histogram.