
skkong
Kong, Seokkyu (공석규)
Recently Published
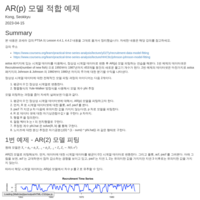
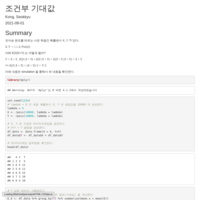
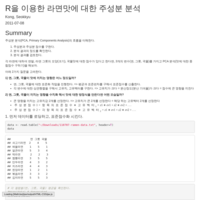
시계열 데이터에 대한 AR(p) 모델 적합 예제
astsa 패키지의 Recruitment 와 Johnson & Johnson 의 분기별 수익에 대한 데이터셋 사용
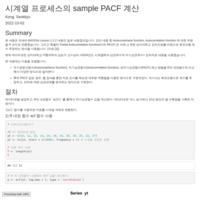
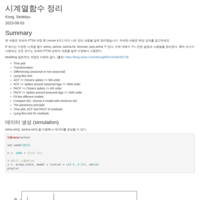
시계열 프로세스의 sample PACF 계산
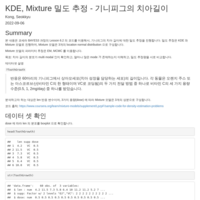
본 내용은 코세라 BAYES4 Lesson 1.2.2 내용의 일부 내용정리입니다. 강의 내용 중 Autocovarinace function, Autocorrelation function 에 대한 부분을 R 코드로 전환했습니다. 그리고 특별히 Partial Autocorrelation function(이하 PACF) 은 아래 소개한 상지대학교 강의자료를 바탕으로 회귀모형 계수 추정하는 방식을 사용합니다.
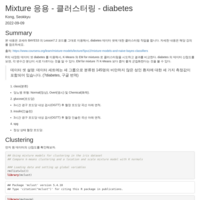
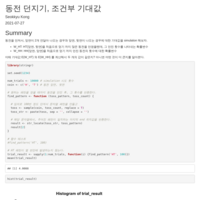
이변량 데이터의 Mixture 모델 구축 (feat: EM 군집 예제)
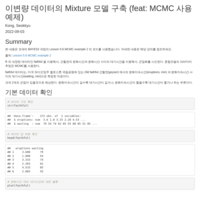
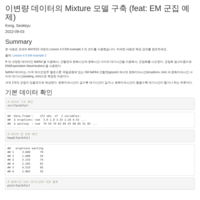
본 내용은 코세라 BAYES3 과정의 Lesson 4.5 EM example 2 의 코드를 사용했습니다. 자세한 내용은 해당 강의를 참조하세요.
출처: Lesson 4.5 EM example 2
R 의 내장된 데이터인 faithful 을 이용해서, 간헐천의 분화시간과 분화시간 사이의 대기시간을 이용해서, 군집화를 시도한다. 군집화 알고리즘으로 EM(Expectation Maximization) 을 사용한다.
faithful 데이터는, 미국 와이오밍주 옐로스톤 국립공원에 있는 Old faithful 간헐천(geyser) 에서의 분화지속시간(eruptions, min) 과 분화지속시간 사이의 대기사간(waiting, min)으로 측정한 자료이다.
크게 2개의 군집이 있을것으로 예상한다. 분화지속시간이 길수록 대기시간이 길거나, 분화지속시간이 짧을수록 대기시간이 짧거나 하는 부류이다.
Document
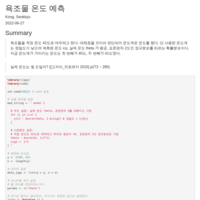
욕조물 온도 추정
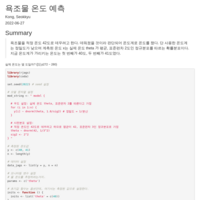
욕조물 온도 예측
RJAGS
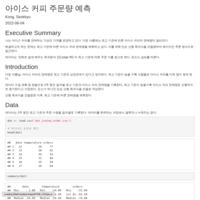
아이스 커피 예측 - RJAGS 를 사용한 선형 회귀 모델 구축
선형회귀모델, RJAGS
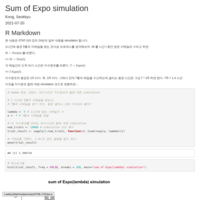
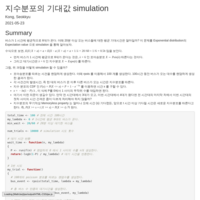
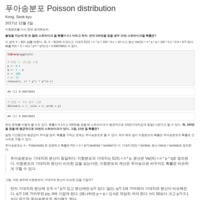
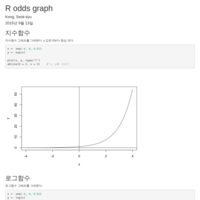
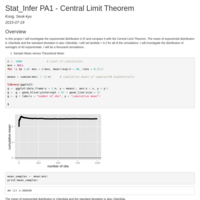
지수분포의 기대값 simulation
지수분포, Exponential distribution, E(X), Memoryless property
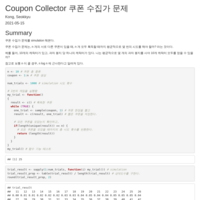
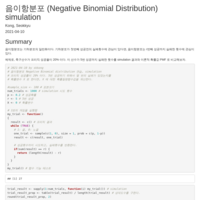
Negative Binomial Distribution Simulation
음이항분포 시뮬레이션
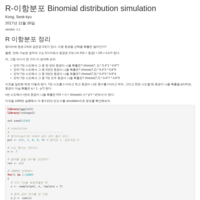
이항분포 simulation
Binomial distribution
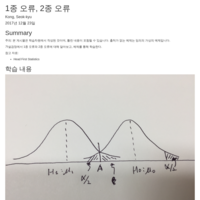
1종오류와 2종오류
1종 오류, 2종 오류
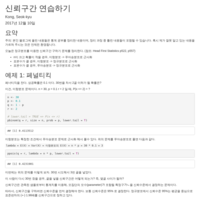
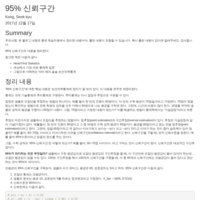
신뢰구간 시뮬레이션
신뢰구간
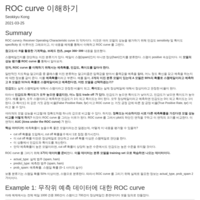
ROC curve 이해하기
ROC, R
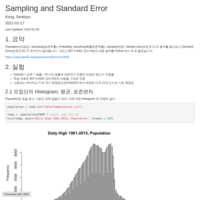
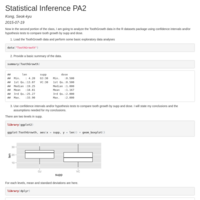
Sampling and Standard Error
샘플링 테스트
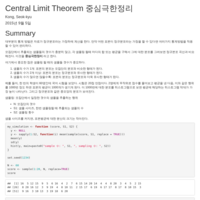
중심극한정리 테스트
테스트 코드
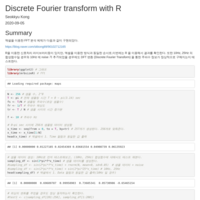
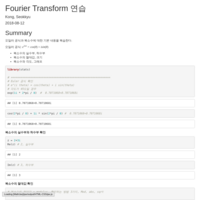
DFT(Discrete Fourier Transform) 코드 검토
DFT, Fourier matrix
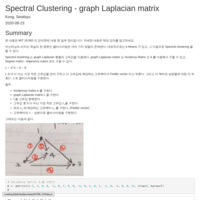
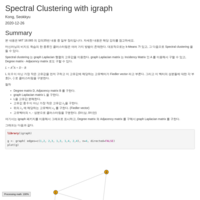
Spectral Clustering - Laplacian matrix
비지도학습, 클러스터링 알고리즘
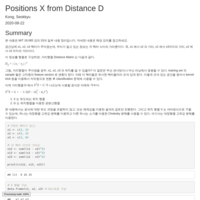
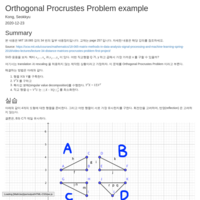
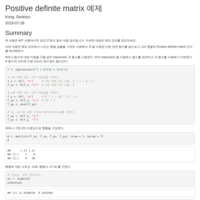
Positions X from Distances D
거리행렬에서 위치행렬 구하기
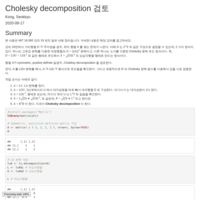
Cholesky decomposition
촐레스키 분해 검토
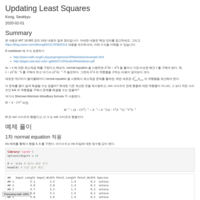
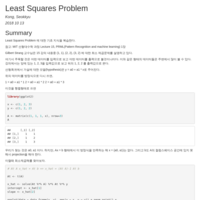
Updating Least Squares
Normal equation, Shermon-Morrison-Woodbury formula

random sampling 을 이용한 AB 계산
random sampling 을 이용한 AB 계산
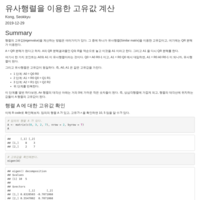
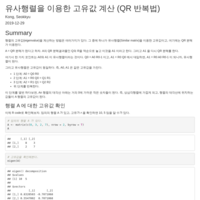
유사행렬을 이용한 고유값 계산하기
QR 분해, 유사행렬, 고유값 eigenvalue
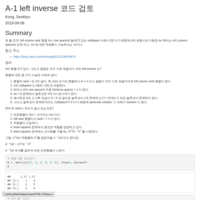
A left inverse
full column rank A 의 left inverse에 대한 코드 검토
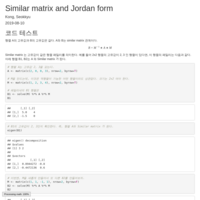
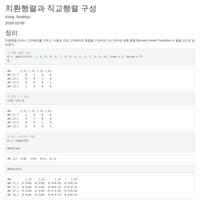
Similar matrix
code test
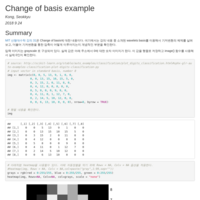
Change of basis
Linear Algebra - change of basis
example) wavelets basis
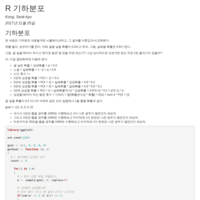
R 기하분포 연습
시뮬레이션자료와 이론값을 비교함
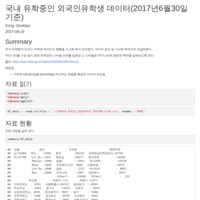
유학생 데이터 분석 연습
유학생 데이터 분석 연습니다.
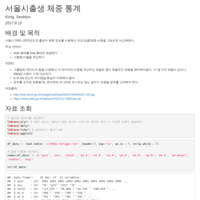
서울시 출생아 체중 비교
서울시 출생아 2001~2015년도 체중비교
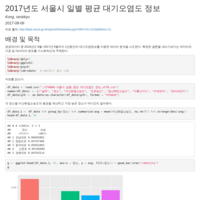
2017년도 서울시 대기오염분석
서울시 대기오염분석
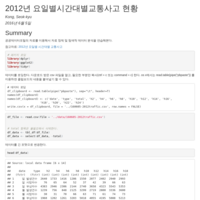
2012년 요일별 시간대별 교통사고 현황
탐색적 데이터 분석 연습
DDP Report - Predicting child height
Developing data products Report
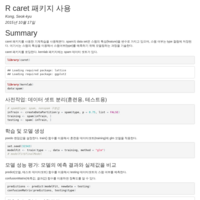
caret 기본 사용법
연습 자료
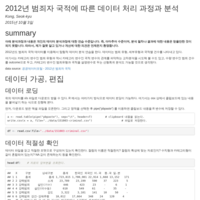
2012년 범죄자 국적에 따른 데이터 처리 과정과 분석
데이터 처리과정
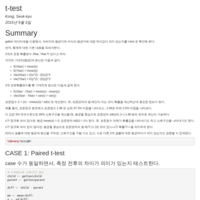
t-test example
t-test에 대한 여러가지 가정들을 테스트한다.
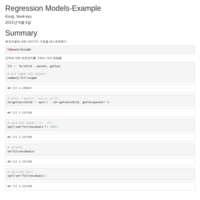
Regression Models Example
회귀모델에 대한 여러가지 가정들을 테스트한다.
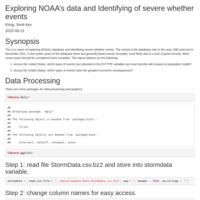
Exploring NOAA’s data and Identifying of severe whether events
This is a report of exploring NOAA’s database and identifying severe whether events. The events in the database start in the year 1950 and end in November 2011. In the earlier years of the database there are generally fewer events recorded, most likely due to a lack of good records. More recent years should be considered more complete. This report address as the following:
Across the United States, which types of events (as indicated in the EVTYPE variable) are most harmful with respect to population health?
Across the United States, which types of events have the greatest economic consequences?
Publish Document - TEST
this is a test