stemangiola
stefano
Recently Published

Myeloid
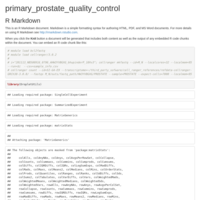
library(tidyverse)
library(tidysc)
library(viridis)
library(future)
plan(multisession, workers=10)
options(future.globals.maxSize = 10000 * 1024^2)
source("functions.R")
myeloid <- readRDS("myeloid.rds")
my_theme =
theme_bw() +
theme(
panel.border = element_blank(),
axis.line = element_line(),
panel.grid.major = element_line(size = 0.2),
panel.grid.minor = element_line(size = 0.1),
text = element_text(size=8),
legend.position="bottom",
strip.background = element_blank()
)
myeloid_adj =
myeloid %>%
tidysc::adjust_abundance(~ integrate(sample))
myeloid_adj_cluster =
myeloid_adj %>%
tidysc::reduce_dimensions("UMAP") %>%
tidysc::cluster_elements(resolution = 0.2)
myeloid_adj_cluster %>%
ggplot(aes(`UMAP 1`, `UMAP 2`)) +
geom_point(aes( color =cluster), size=1, alpha=0.5) +
facet_wrap(~sample, ncol=2,dir = "v") +
my_theme + theme(aspect.ratio=1)
myeloid_adj_cluster_cell =
myeloid_adj_cluster %>%
tidysc::deconvolve_cellularity()
myeloid_marker_heatmap = myeloid_adj_cluster_cell %>% attr("seurat") %>% .[[1]] %>% ComputeMarkers
markers_myeloid =
list(
macrophage = c("GPNMB", "APOE", "A2M", "NRP1", "CD11b", "CD33", "CD11c", "CD36", "ITGAM"),
monocyte = c("SELL", "CFP", "PROK2", "CD14"),
granulocyte = c("TRPM6", "DAPK2", "MMP25", "FUT4"),
dendritic = c("CCL13", "FN1", "A2M", "CD209", "CD1C", "CCL26", "ITGAM", "CD11b", "CD11a"),
other = c("FCGR3A", "CD163", "CD34", "GZMH")
)
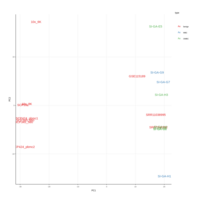
myeloid_adj_cluster_cell %>%
# Extract abundance
extract_abundance(markers_myeloid %>% unlist %>% unique) %>%
{
ggplot((.), aes(`UMAP 1`, `UMAP 2`, z = abundance_SCT)) +
geom_point(data = (.) %>% dplyr::filter(abundance_SCT==0), color="grey", shape=".") +
stat_summary_hex(data = (.) %>% dplyr::filter(abundance_SCT>0), binwidth = c(.2, .2), fun=sum) +
facet_wrap(~transcript) +
scale_fill_viridis(option="magma") +
my_theme +
theme(aspect.ratio=1)
}
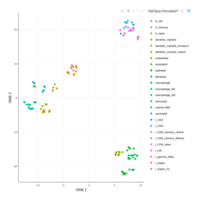
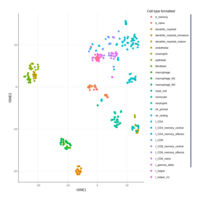
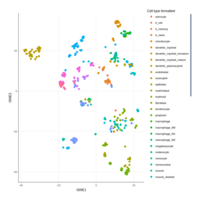
(myeloid_adj_cluster_cell %>%
dplyr::select(
sample, cell, cluster, label_hpca,
label_curated_pass_1,
contains("UMAP")
) %>%
pivot_longer(
cols = c(cluster, label_hpca, label_curated_pass_1),
names_to = "database",
values_to="label"
) %>%
ggplot(aes(`UMAP 1`, `UMAP 2`)) +
geom_point(aes( color =label), size=1, alpha=0.5) +
facet_wrap(~database, ncol=2,dir = "v") +
my_theme + theme(aspect.ratio=1) ) %>% plotly::ggplotly()
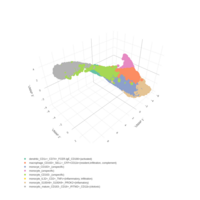
myeloid_adj_cluster_cell =
myeloid_adj_cluster_cell %>%
tidysc::left_join(
c(
"5" = "dendritic_CD1c+_CD74+_FCER.IgE_CD166+(activated)",
"2" = "monocytic_mature_CD163-_CD16+_IFITM2+_CD11b-(citotoxic)",
"7" = "monocyte_IL32+_CD2+_TNFc+(inflammatory, infiltration)",
"3" = "monocyte_CD163-_(unspecific)",
"1" = "monocye_CD163+_(unspecific)",
"6" = "macrophage_CD163+_SELL+_CFP+CD11b+(resident,infiltration, complement)",
"4" = "monocyte_(unspecific)",
"0" = "monocyte_S100A8+_S100A9+_PROK2+(inflamatory)"
) %>%
enframe(name = "cluster", value = "label_curated_pass_2"),
by="cluster"
)
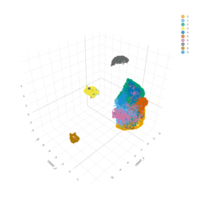
myeloid_adj_cluster_cell %>%
sample_n(5000) %>%
plotly::plot_ly(
x = ~`UMAP 1`,
y = ~`UMAP 2`,
z = ~`UMAP 3`,
color = ~`label_curated_pass_2`
) %>%
plotly::layout(legend = list(orientation = 'h'))
total_lymphoid
my_theme =
theme_bw() +
theme(
panel.border = element_blank(),
axis.line = element_line(),
panel.grid.major = element_line(size = 0.2),
panel.grid.minor = element_line(size = 0.1),
text = element_text(size=8),
legend.position="bottom",
strip.background = element_blank()
)
lymphoid_adj =
lymphoid %>%
tidysc::adjust_abundance(~ integrate(sample))
lymphoid_adj_cluster =
lymphoid_adj %>%
tidysc::reduce_dimensions("UMAP") %>%
tidysc::cluster_elements(resolution = 0.2)
lymphoid_adj_cluster %>%
ggplot(aes(`UMAP 1`, `UMAP 2`)) +
geom_point(aes( color =cluster), size=1, alpha=0.5) +
facet_wrap(~sample, ncol=2,dir = "v") +
my_theme + theme(aspect.ratio=1)
lymphoid_adj_cluster_cell =
lymphoid_adj_cluster %>%
tidysc::deconvolve_cellularity()
lymphoid_marker_heatmap = xx %>% attr("seurat") %>% .[[1]] %>% ComputeMarkers
markers_lymphoid =
list(
t_cell = c("CD248", "ALS2CL", "FAAH2"),
natural_killer = c("KRT81", "CATSPER1", "CCNJL", "MTRNR2L6"),
CD4 = c("FBLN7", "ST6GALNAC1"),
CD8 = c("KLRC3"),
others = c("CD4", "CD8A", "CD3E", "CD3G", "CD19", "MS4A1", "NCAM1","FOXP3", "CTLA4",
"PDCD1", "MKI67", "NKG7", "PECAM", "ICOS", "IL6R", "IL10RB")
)
lymphoid_adj_cluster_cell %>%
# Extract abundance
extract_abundance(markers_lymphoid %>% unlist %>% unique) %>%
{
ggplot((.), aes(`UMAP 1`, `UMAP 2`, z = abundance_SCT)) +
geom_point(data = (.) %>% dplyr::filter(abundance_SCT==0), color="grey", shape=".") +
stat_summary_hex(data = (.) %>% dplyr::filter(abundance_SCT>0), binwidth = c(.2, .2), fun=sum) +
facet_wrap(~transcript) +
scale_fill_viridis(option="magma") +
my_theme +
theme(aspect.ratio=1)
}
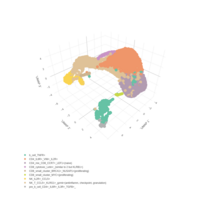
lymphoid_adj_cluster_cell =
lymphoid_adj_cluster_cell %>%
tidysc::left_join(
c(
"3" = "b_cell_TNFR+",
"6" = "pre_b_cell_CD4+_IL6R+_IL3R+_TGFB+_",
"4" = "NK_IL2R+_CCL5+",
"2" = "NK_T_CCL5+_KLRG1+_gzmk+(antiinflamm, checkpoint, granulation)",
"5" = "CD8_cytotoxic_Letin+_(similar to 2 but KLRB1+)",
"1" = "CD4_mix_CD8_CCR7+_LEF1+(naive)",
"0" = "CD4_IL6R+_VIM+_IL2R+",
"7" = "CD8_small_cluster_BRCA1+_NUSAP1+(proliferating)",
"8" = "CD8_small_cluster_MYC+(proliferating)"
) %>%
enframe(name = "cluster", value = "label_curated_pass_2"),
by="cluster"
)
lymphoid_adj_cluster_cell %>%
sample_n(5000) %>%
plotly::plot_ly(
x = ~`UMAP 1`,
y = ~`UMAP 2`,
z = ~`UMAP 3`,
color = ~`label_curated_pass_2`
) %>%
plotly::layout(legend = list(orientation = 'h'))

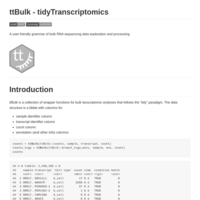
ttBulk
Readme of ttBulk package