thanhqtran
Quang-Thanh Tran
Recently Published

[Fun DS] Interactive Plots of New Province Changes in Vietnam
This shows you a simple way to visualize the change in provinces in Vietnam after July 1, 2025, using Python and Plotly.

(Fun DS) Extracting Google Health data in Python
Extracting Walking Distance and Sleeping Data from Apple Health.

(Fun DS) Extracting Wordpress Stats with Python
We are going to learn how to access WordPress stats to extract relevant information and visualize it in Python.
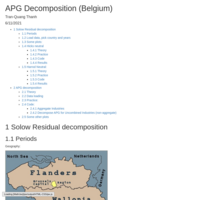
Aggregate Productivity Growth (APG) Decomposition (for Belgium)
Growth accounting Exercise with Solow production function, Hick's Neutral case and Harrod's Neutral case using PWT.
APG growth accounting to differentiate technological gain and reallocation gain using industry-level microdata published by EUKLEMS.