
tskam
Tin Seong, KAM
Recently Published
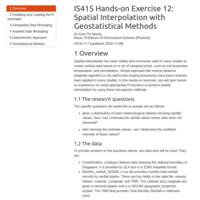
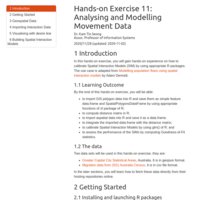
IS415 Hands-on Exercise 11: Analysing and Modelling Movement Data
In this hands-on exercise, you will learn how to calibrate Spatial Interaction Models by using R.
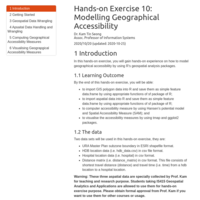
IS415 Hands-on Exercise 10: Modelling Geographical Accessibility
In this hands-on Exercise, you will learn how to model geographical accessibility using SpatialAcc package of R.
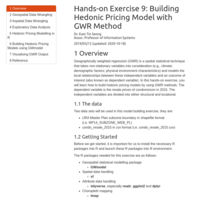
IS415 Hands-on Exercise 9: Building Hedonic Pricing Model with GWR Method
In this hands-on exercise, you will learn how to build hedonic pricing model for private residential property of Singapore.
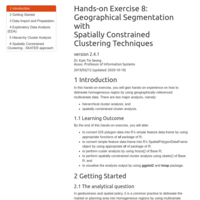
Hands-on Exercise 8: Geographical Segmentation with Spatially Constrained Clustering Techniques
In this hands-on exercise, you will learn how to perform hierarchical clustering and spatial constraint clustering by using R packages.
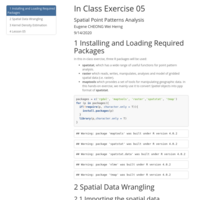
IS415 Sample In-class Exercise 5
This is an example of in-class exercise prepared by your classmate.
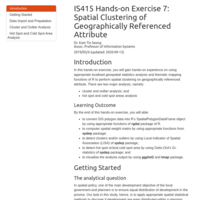
IS415 Hands-on Exercise 7: Spatial Clustering of Geographically Referenced Attribute
In this hands-on exercise, you will gain hands-on experience on using appropriate localised geospatial statistics analysis and thematic mapping functions of R to perform spatial clustering on geographically referenced attribute.
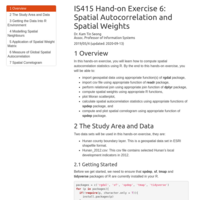
IS415 Hands-on Exercise 6: Spatial Autocorrelation and Spatial Weights
In this hands-on exercise, you will learn how to compute spatial autocorrelation statistics using R.
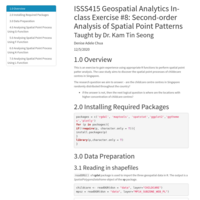
IS415 Hands-on Exercise 5: Second-order Analysis of Spatial Point Patterns
In this hands-on exercise, you will gain hands-on experience on using appropriate R functions to analyse spatial point events. The case study aims to discover the spatial point processes of childecare centres in Singapore.
IS415 Hands-on Exercise 4: First-order Spatial Point Patterns Analysis
In this hands-on exercise, you will gain hands-on experience on using appropriate R functions to gain insight from spatial point processes. The case study aims to discover the spatial point processes of childecare centres in Singapore.
IS415 Hands-on Exercise 3: Proportional Symbol mapping with R
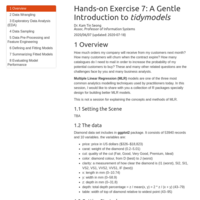
In this hands-on exercise, you will learn how to create proportional symbol map using tmap. You will also learn how to convert an aspatial data into spatial point feature data frame by using sf. Lastly, you will also learn how to create interactive map views with tmap.
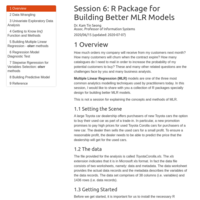
Session06-R Packages for Building Better MLR Models
In this session, we would like to share with you a collection of R packages for building better Multiple Linear Regression.
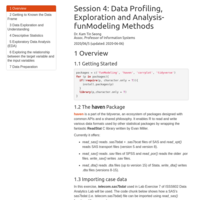
R4DSA Session 4: Data Profiling, Exploration and Analysis-funModeling methods
In this session, you will learn how to perform data profiling, exploration and analysis using funModeling package of R.
IS415-Hands-on Exercise 8 (Supplement)
Section 7.3 of this hands-on exercise provide an excellent example on how to improve the interpretability of statistical plot by using interative graphic.
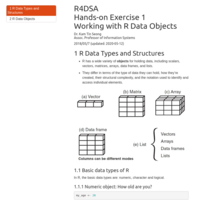
R4DSA: Hands-on Exercise 1-Working with R Data Objects
In this hands-on exercise, you will learn how to working with the basic R data type and R data objects.
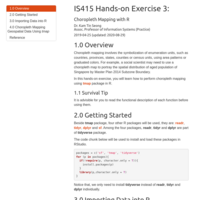
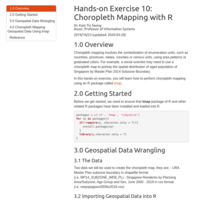
IS415 Hands-on Exercise 3: Choropleth Mapping with R
In this hands-on exercise, you will learn how to plot choropleth maps using tmap package in R and RStudio. You will also learn how to use sf package to handling geospatial data and dplyr and tidyr to perform data wrangling task.

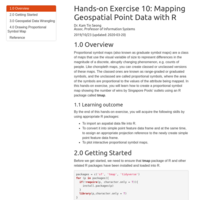
Hands-on Exercise 3: Mapping Geospatial Point Data with R
In this hands-on exercise, you will learn how to prepare proportional symbol maps using tmap package in R and RStudio. You will also learn how to using appropriate sf functions to prepare the data for the mapping exercise.
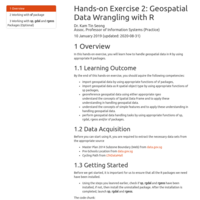
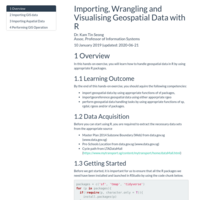
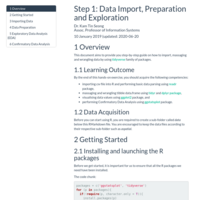
IS415-Hands-on Exercise 2: Geospatial Data Wrangling in R
In this hands-on exercise, you will gain hands-on experience on using sf and other related packages to perform geospatial data wrangling tasks in R.
Choropleth Mapping with R
In this hands-on exercise, you will learn how to perform choropleth mapping using an R package called tmap.
Mapping Geospatial Point Data with R
In this hands-on exercise, you will learn how to create a proportional symbol map showing the number of wins by Singapore Pools’ outlets using an R package called tmap.
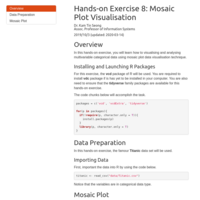
Mosaic Plot Visualisation
In this hands-on exercise, you will learn how to visualising and analysing multivariable categorical data using mosaic plot data visualisation technique.
Creating Parallel Coordinate Plot
In this hands-on exercise, you will learn how to plot parallel coordinates plot in R.
Creating Ternary Plot with R
In this hands-on exercise, you will learn how to plot static and interactive ternary diagrams by using ggtern and Plotly R respectively. You will also learn how to perform data wrangling by using appropriate dplyr and tidyr packages.
Visualising Correlation Matrix
In this hands-on exercise, you will learn how to plot correlation matrix using appropriate R packages.
Heatmap Visualisation with R
In this hands-on exercise, you will learn how to plot static and interactive heatmaps in R programmatically.
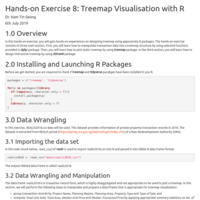
Hands-on Exercise 8: Treemap Visualisation with R
In this hands-on exercise, you will gain hands-on experiences on designing treemap using appropriate R packages. The hands-on exercise consists of three main sections. First, you will learn how to manipulate transaction data into a treemap structure by using selected functions provided in dplyr package. Then, you will learn how to plot static treemap by using treemap package. In the third section, you will learn how to design interactive treemap by using d3treeR package.
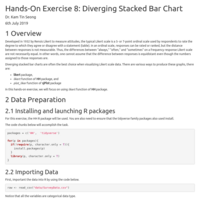
Hands-On Exercise 8: Diverging Stacked Bar Chart
In this hands-on exercise, you will learn how to plot diverging stacked bar charts using likert function of HH package.