
ttaylor14
Todd Taylor
Recently Published
Procrastination Fantasy Baseball: Baseball Historical Study, Part 3
The following synopsis of information analyzes and explores the unlike qualities of the Procrastination Fantasy Point system. Its intention is to find player correlations that can benefit selection and predictability of players.
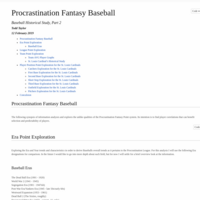
Procrastination Fantasy Baseball: Baseball Historical Study, Part 2
The following synopsis of information analyzes and explores the unlike qualities of the Procrastination Fantasy Point system. Its intention is to find player correlations that can benefit selection and predictability of players.

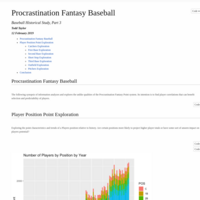
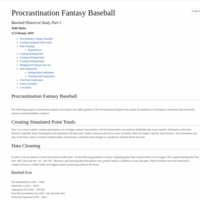
Procrastination Fantasy Baseball: Baseball Historical Study, Part 1
The following synopsis of information analyzes and explores the unlike qualities of the Procrastination Fantasy Point system. Its intention is to find player correlations that can benefit selection and predictability of players.
Procrastination Fantasy Baseball: Baseball Historical Study, Part 1 (OLD)
The following synopsis of information analyzes and explores the unlike qualities of the Procrastination Fantasy Point system. Its intention is to find player correlations that can benefit selection and predictability of players.
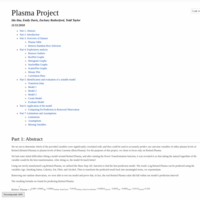
Plasma Project
We set out to determine which of the provided variables were significantly correlated with–and thus could be used to accurately predict–our outcome variables of either plasma levels of Retinol (Retinol.Plasma) or plasma levels of Beta Carotene (Beta.Plasma). For the purposes of this project, we chose to focus only on Retinol.Plasma.
We had some initial difficulties fitting a model around Retinol.Plasma, and after running the Power Transformation function, it was revealed to us that taking the natural logarithm of the variable would be the best transformation. After doing so, the model fit much better!
Using our newly transformed Log.Retinol.Plasma, we utilized the Mass Step AIC function to find the best prediction model. The result: Log.Retinol.Plasma can be predicted using the variables Age, Smoking.Status, Calories, Fat, Fiber, and Alcohol. Then to transform the predicted result back into meaningful terms, we exponentiate.
Removing one random observation, we were able to test our model and prove that, in fact, the real Retinol.Plasma value did fall within our model’s prediction interval!
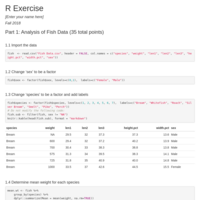
R Exercise
The purpose of this exercise is to help me become more comfortable working in the R environment
and to learn how to use certain functions to interact with data.
The first dataset: Fish Data
This dataset consists of 159 observations of 8 variables (plus an observation ID column), and
represents measurements of several species of fish taken from a lake in Finland.
The second dataset: Forbes
This dataset is a listing of the world’s 2,000 largest public companies according
to Forbes for the year 2014.