
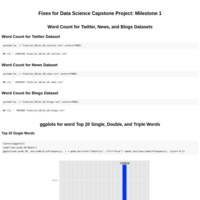
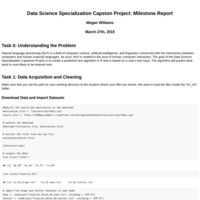
williamsmr
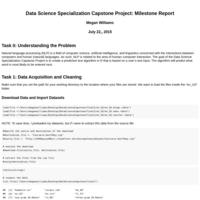
Megan Williams
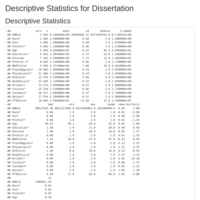
Recently Published
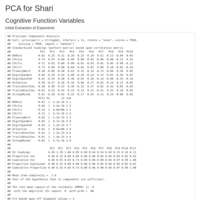


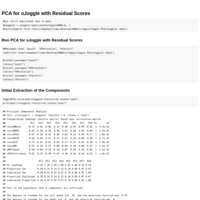
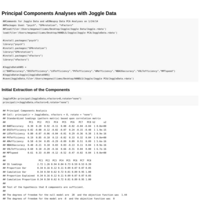
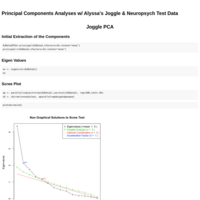
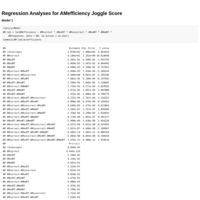
Joggle PCA
PCA with Joggle data only
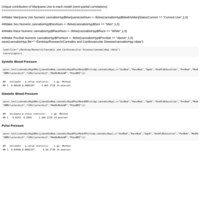


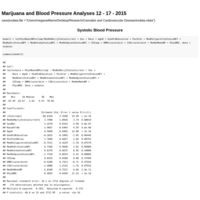


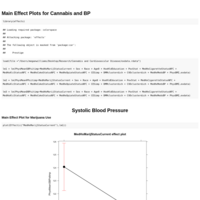
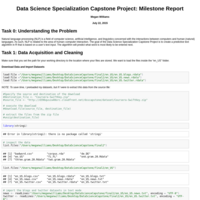
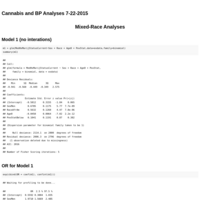
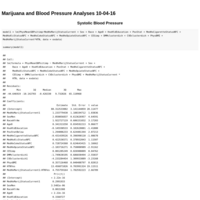
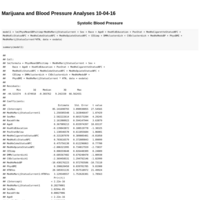
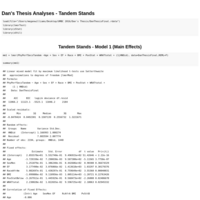
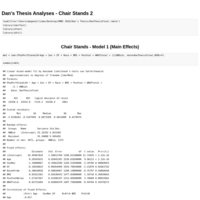
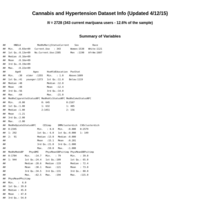
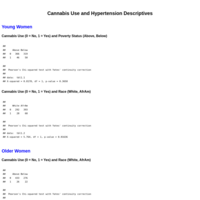
Cannabis and BP Analyses 7-22-2015
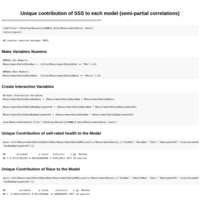
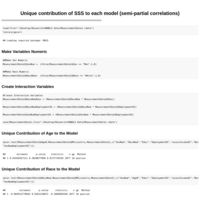
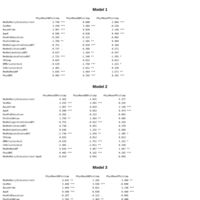
Multivariable logistic regression analyses for Cannabis and BP HANDLS data (with no interactions and with 2-way interactions) -- Mixed race, and stratified by race
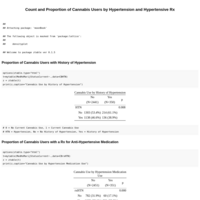
6-22-15 Cannabis and BP Analyses
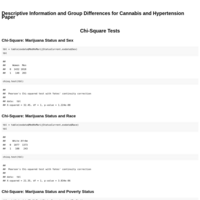
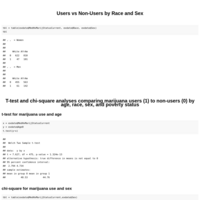
Cannabis and BP analyses exploring the following interactions: Marijuana use x Sex, Marijuana use x Race, Marijuana use x Age, and Marijuana use x Poverty Status

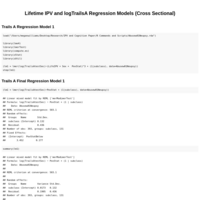
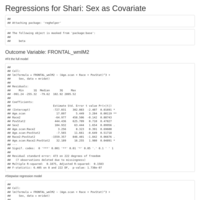
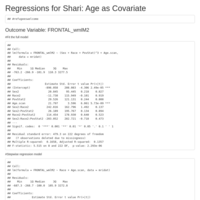
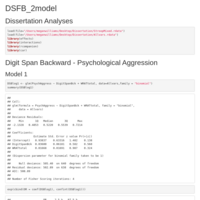
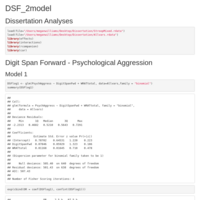
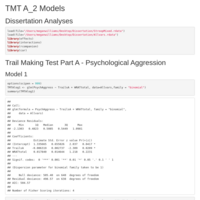
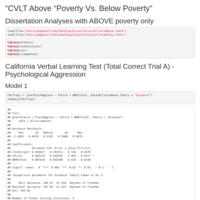
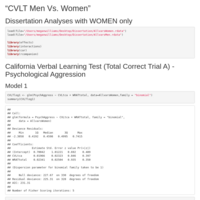
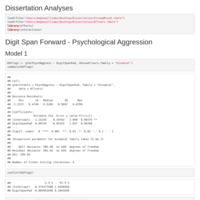
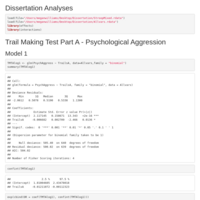
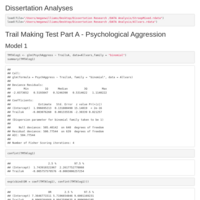
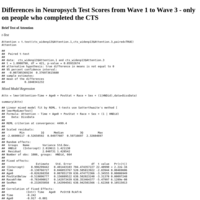
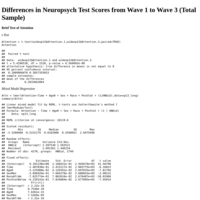
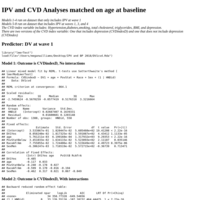
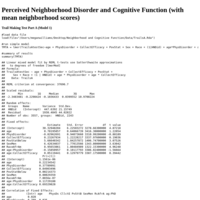
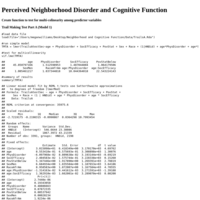
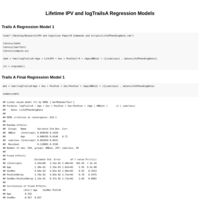
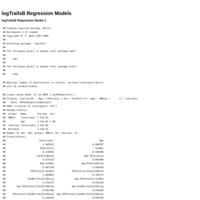
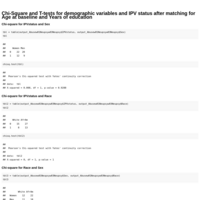
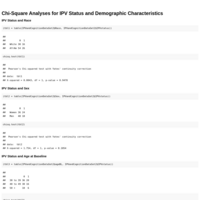
Lifetime IPV and logTrailsA Regression Models (Cross Sectional)
Lifetime IPV and cognitive function regression models (cross-sectional analysis); participants matched on age at baseline and years of education
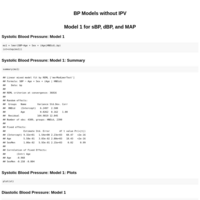
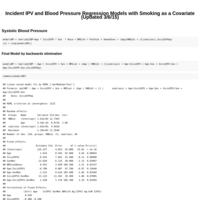
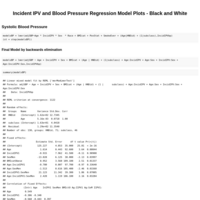
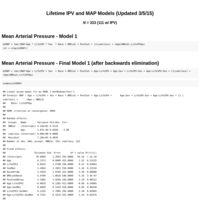
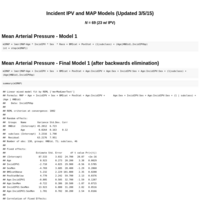
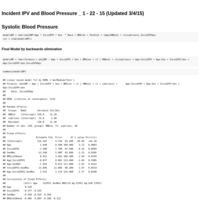
Incident IPV and Blood Pressure Regression Models with Smoking as a Covariate (Updated 3/6/15)
Incident and Lifetime IPV and BP Regression models with smoking added as a covariate
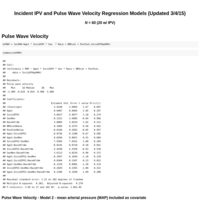
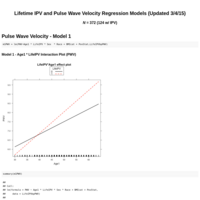
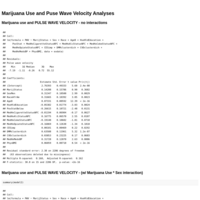
Lifetime IPV and Pulse Wave Velocity Regression Model (Updated 3/1/15)
Lifetime IPV and pulse wave velocity regression model
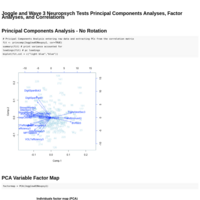
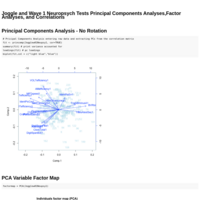
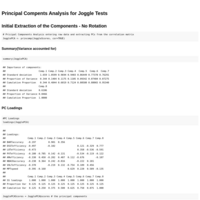
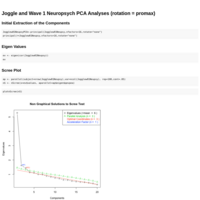
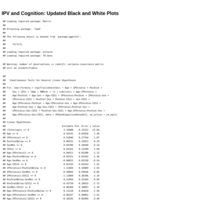
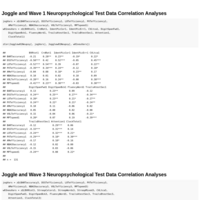
Joggle and Wave 1 Neuropsych PCA Analyses (rotation = promax)
Joggle and Wave 1 Neuropsych principal components analyses with promax rotation

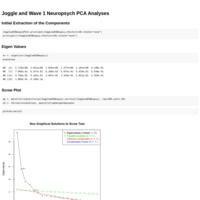
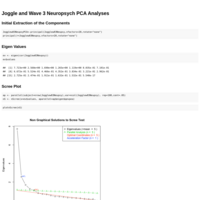
Joggle and Wave 3 Neuropsych PCA Analyses (rotation = promax)
Joggle and Wave 3 Neuropsych PCA with promax rotation
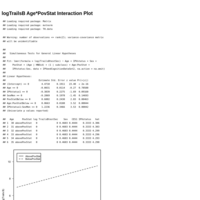
CannabisBP_Agex_1-21-15
Cannabis and Blood Pressure regression models with age at a median split.

CannabisBP_Agex_BMI
Cannabis use and BMP regression models where age is split at the median and interactions are explored for current marijuana use and Age, Sex, Race, Poverty Status, and BMI.


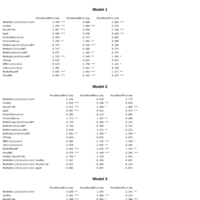
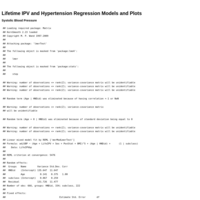
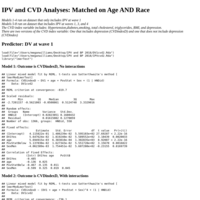
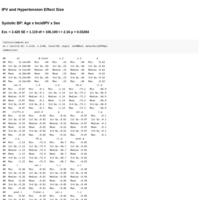
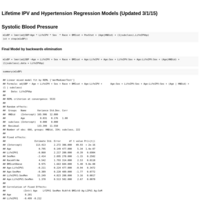
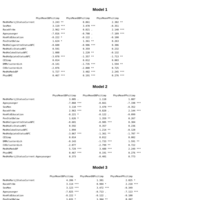
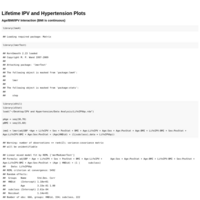
Lifetime IPV and Hypertension Regression Models and Plots
Regression models for Lifetime IPV and blood pressure change over time

Lifetime IPV and Hypertension Regression Models and Plots
Regression Models and Interaction Plots for Lifetime IPV and Hypertension (includes models with BMI as continuous and categorical)
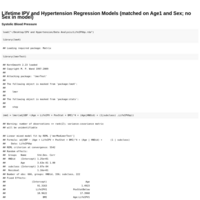
Lifetime IPV and Hypertension Regression Models (matched on Age1 and Sex; no Sex in model)
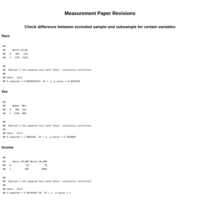
Regression models for lifetime IPV and hypertension in which sex was excluded from the regression model (participants were matched on Age1 and sex).

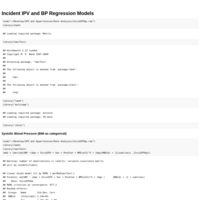
Incident IPV and BP Regression Models
Incident IPV and BP regression models ; participants were matched on Age at baseline


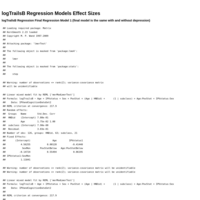
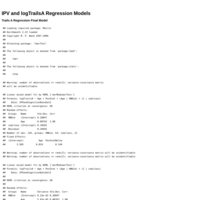
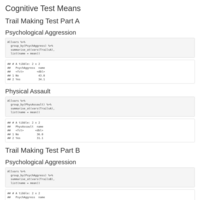
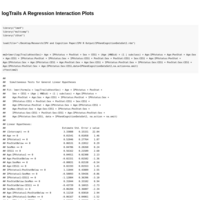
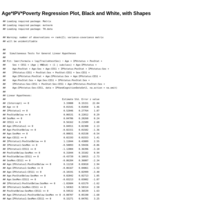
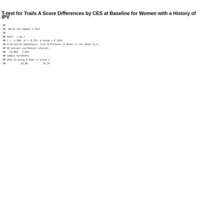
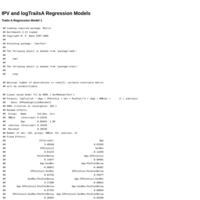
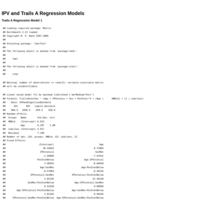
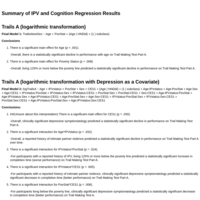
IPV and logTrailsA Regression Models
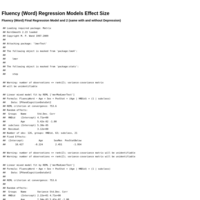
Trails A and IPV effect size calculations based on t-value using compute.es package in R.

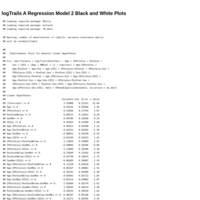
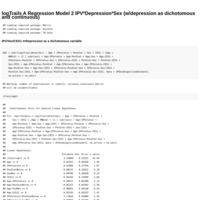
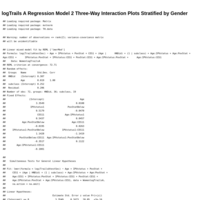
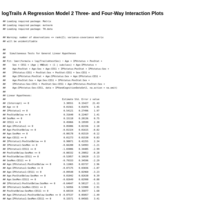
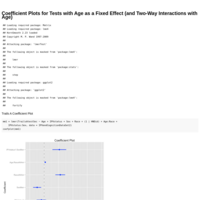
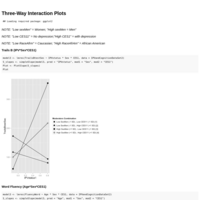
logTrails A Regression Model 2 IPV*Depression*Sex (w/depression as dichotomous and continuous)
logTrails A Regression Model 2 interaction plots for IPV*Depression*Sex (w/depression as dichotomous and continuous)


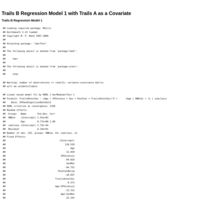
logTrailsB Regression Models
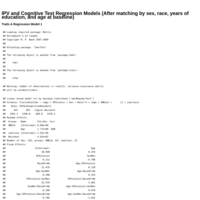
IPV and TMT Part B Regression Models. Controls are matched on years of education and age at Wave 1.
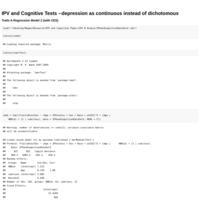
IPV and Cognitive Tests --depression as continuous instead of dichotomous
IPV and Cognitive Test Regression models with depression treated as a continuous variable as opposed to a dichotomous variable
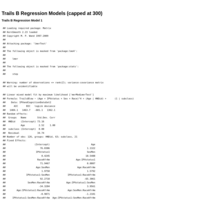
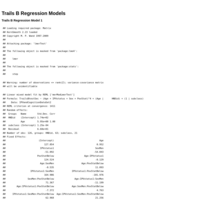
Trails B Regression Models (capped at 300)
Regression models for Trail Making Test B when scores are capped at 300.
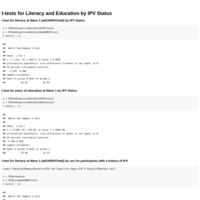
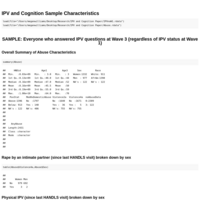
t-tests for Literacy and Education by IPV Status / Scatterplots for Cognitive Tests and Sex by IPV Status
t-tests for Literacy and Education by IPV Status AND Scatterplots for Cognitive Tests and Sex by IPV Status
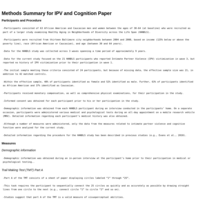
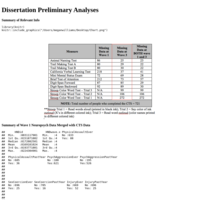
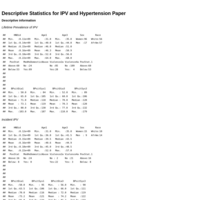
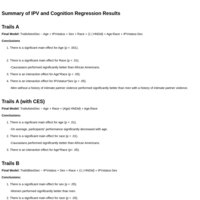
Methods Summary for IPV and Cognition Paper
Bullet-point summary of participants, procedure, measures, and statistical analyses for the IPV and Cognition paper.
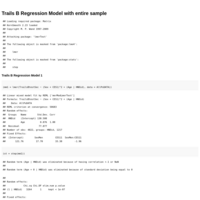
Trails B Regression Model with entire sample
Trails B and Depression Regression models with the entire sample (instead of just with the IPV group and matched controls).

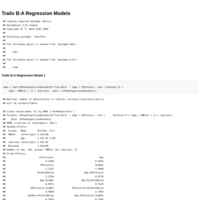
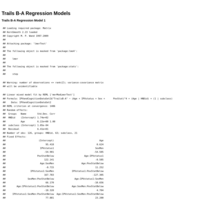

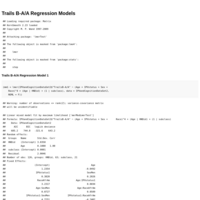
Trails B-A/A Regression Models
Regression models for Trails B - Trails A / Trails A Scores.
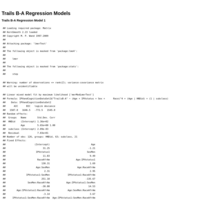
Trails B:A Regression Models
Regression models for TMT Part B / TMT Part A. This ratio of performance is said to provide a valid index of executive functioning (Arbuthnott & Frank, 2000).
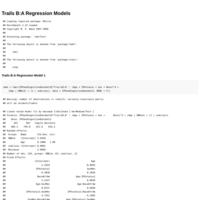
Trails B-A Regression Models
Regression models for Trail Making Test B - Trail making Test A. This measure is said to remove the manual dexterity component from the TMT scores.
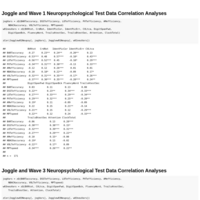
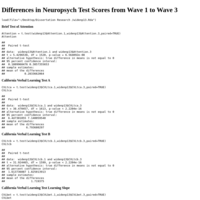
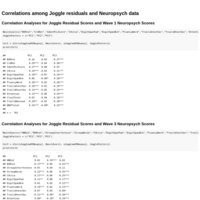
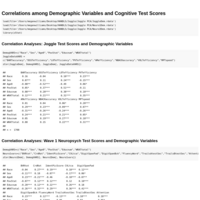
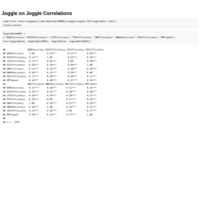
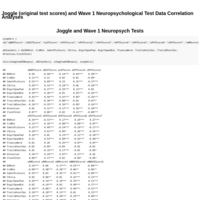
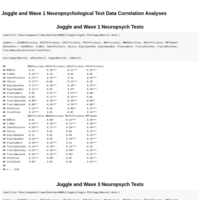
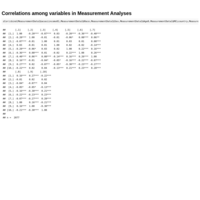
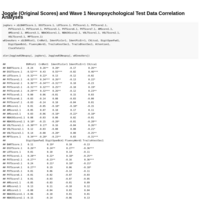
Joggle and Wave 1 Neuropsychological Test Data Correlation Analyses
Correlation analyses for Joggle Data and Waves 1 and 3 Neuropsychological Test Data.

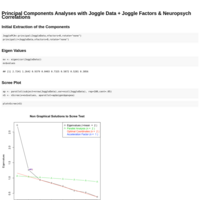
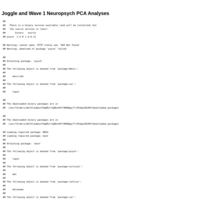
Joggle and Wave 1 Neuropsych PCA Analyses
Principal Components Analyses for Joggle and Wave 1 Neuropsych Data.
NOTE: Last updated on 6/03/14
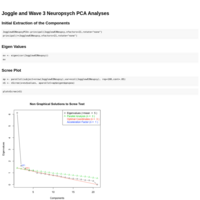
Joggle and Wave 3 Neuropsych PCA Analyses
Principal Components Analyses for Joggle and Wave 3 Neuropsych Data
NOTE: Last updated on 06/03/14
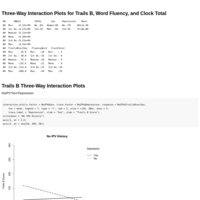
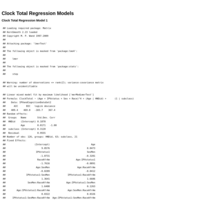
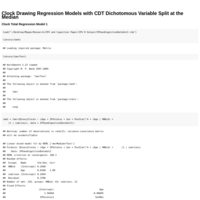
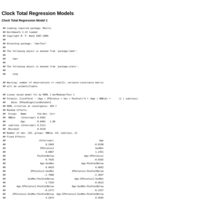
Clock Total Regression Models
Regression models for intimate partner violence and Clock Drawing Test totals (with and without depression as a covariate).
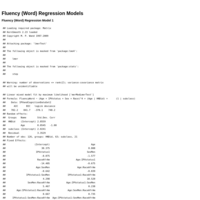
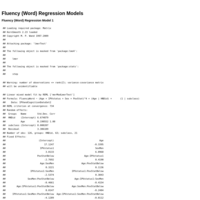
Fluency (Word) Regression Models
Regression models for intimate partner violence and word fluency (with and without depression as a covariate).
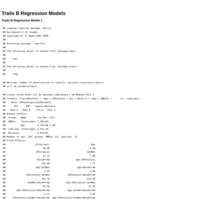
Trails B Regression Models
Regression models for intimate partner violence and Trail Making Test B (with and without depression as a covariate).
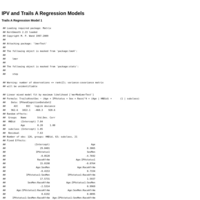
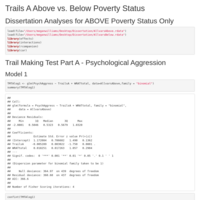
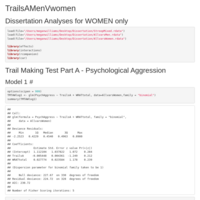
IPV and Trails A Regression Models
Regression Models for Intimate Partner Violence and Trails Making Test A (with and without depression as a covariate).