
yogat3ch
Stephen Holsenbeck
Recently Published
Peters et al. 2017 - Uncertainty and stress
#Abstract The term stress coined in 1936 has many de f nitions, but until now has lacked a theoretical foundation. Here we present an information-theoretic approach based on the free energy principle de f ning the essence of stress namely, uncertainty. We address three questions: What is uncertainty? What does it do to us? What are our resources to master it? Mathematically speaking, uncertainty is entropy or expected surprise . The free energy principle rests upon the fact that self-organizing biological agents resist a tendency to disorder and must therefore minimize the entropy of their sensory states. Applied to our everyday life, this means that we feel uncertain, when we anticipate that outcomes will turn out to be something other than expected and that we are unable to avoid surprise. As all cognitive systems strive to reduce their uncertainty about future outcomes, they face a critical constraint: Reducing uncertainty requires cerebral energy. The characteristic of the vertebrate brain to prioritize its own high energy is captured by the notion of the sel f sh brain . Accordingly, in times of uncertainty, the sel f sh brain demands extra energy from the body. If, despite all this, the brain cannot reduce uncertainty, a persistent cerebral energy crisis may develop, burdening the individual by allostatic load that contributes to systemic and brain malfunction (impaired memory, atherogenesis, diabetes and subsequent cardio- and cerebrovascular events). Based on the basic tenet that stress originates from uncertainty, we discuss the strategies our brain uses to avoid surprise and thereby resolve uncertainty. 2017 The Authors. Published by Elsevier Ltd. This is an open access article under the CC BY-NC-ND license (http://creativecommons.org/licenses/by-nc-nd/4.0/). p.1 (Peters et al., 2017)
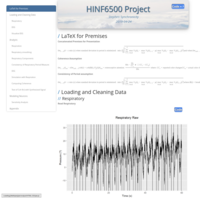
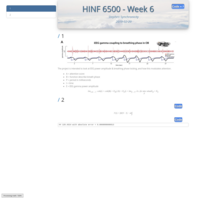
HINF6500 Project: Breath Coherence and Attention
Predictive Analytics and modeling project on gamma brainwave EEG coherence with breathing rhythm and it's relationship to attention.
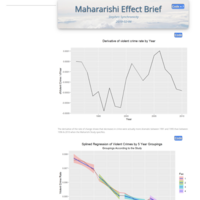
Mararishi Effect Brief
A brief analysis examining the claims made in Dillbeck, M. C., & Cavanaugh, K. L. (2016). Societal Violence and Collective Consciousness: Reduction of U.S. Homicide and Urban Violent Crime Rates. SAGE Open, 6(2), 215824401663789. https://doi.org/10.1177/2158244016637891
Capstone Documentation
A chronicle of the research for the Northeastern Master of Health Data Analytics Capstone
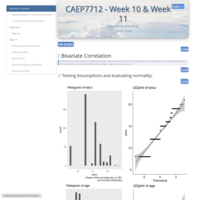
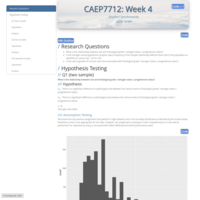
CAEP7712 - Week 10: Regression
Week 10 covers regression with employment data.
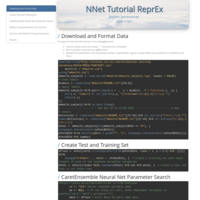
HINF6400 - Neural Net Tutorial ReprEx
Training a neural net using caretEnsemble and the neuralnet package.
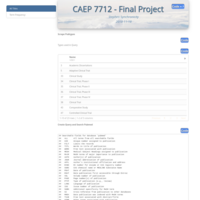
CAEP 7712 Final Project
Final Project for Intermediate Statistics
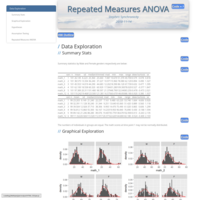
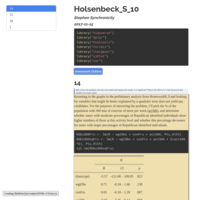
Repeated Measures ANOVA
Repeated Measures ANOVA with math scores across gender between grade levels.
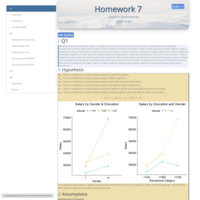
CAEP 7712 Week 7 Homework
Two-Way Anova and interaction plot interpretation
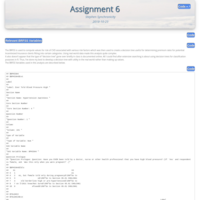
HINF6400 - Assignment 6
Decision Tree
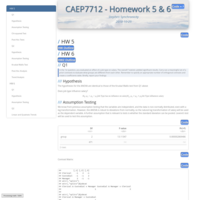
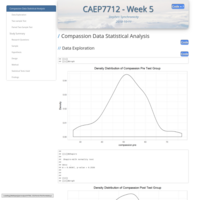
CAEP7712 - Homework 5 (Week 6)
This is the homework for Week 5, comparison of means across categorical and ordinal factors.
CAEP7712 - T-tests Part 2
Another t-test related assignment.
HINF5102 - Week 5 Appendix
These are additional supplemental materials including highlights and tables from the Week 5 reading
CAEP7712 - Comparison of Means Tests and Effect Sizes
Using a breast cancer survival data set, t-tests, Mann-whitney and z-tests are used to compare pathological tumor sizes across various categories in the data. Demonstrates use of one-sample, two-sample, paired, non-parametric and parametric tests for comparison of means.
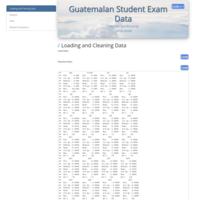
HINF 6400 - Week 3 HW Guatemalan Students
Cleaning the Guatemalan Students dataset
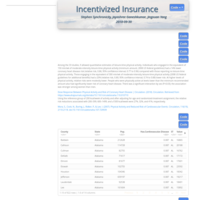
HINF 6400: Incentivized Insurance
Study Overview: https://docs.google.com/presentation/d/1FLSdL59FaTqON2YmmPSuRCx0nQo6-WINbTldjNLrRvw/edit?usp=sharing
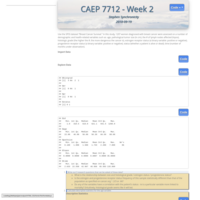
CAEP 7712 - Week 2
Descriptive a basic statistics overview with the Breast cancer survival dataset
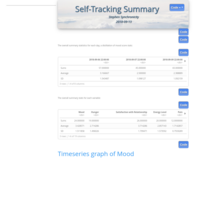
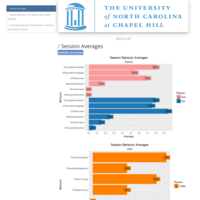
CAEP7712 - Self Tracking Summary
A week of self-tracking on specific variables, summarized
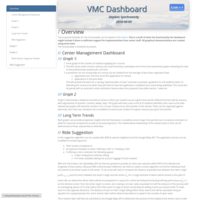
VMC Dashboard
A demo of functionality the VMC dashboard might include
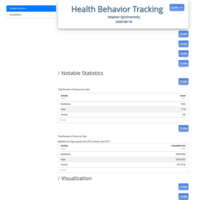
Health Tracking Summary
A 'Quantified Self' exploration of health behaviors.
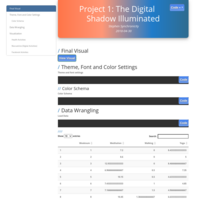
PPUA 5302 - Project 1: The Digital Shadow Illuminated
Project 1 for Information Design and Visual Analytics entitled "The Digital Shadow Illuminated." Data is aggregated from all self-tracking collections including Rescuetime, Insight Timer, and the Facebook activity log to create a snapshot of the quantified self for 2017.
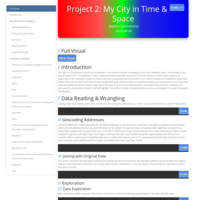
PPUA5302 Project 2: My City in Time & Space
This project takes a look at spatial and temporal data through an exploration of the city of Waltham. Visualizations include:
- Access to polling places based on income
- Methods for making canvassing more efficient using:
- k-means and hierarchical clustering to create clusters of locations that are close together
- knn and the Google API to find the shortest walking path through a cluster
DA5030 & PPUA5302 Final Project - Finance for Freelancers
A Modeling and Visualization Exploration
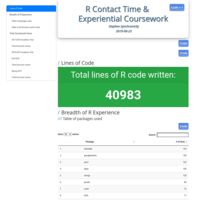
R Experience - Overview
This is an overview of the experience gained writing code in R since starting to learn R in August 2017. It includes total lines written, total lines written for the Northeastern Data Analytics cert., all pkgs used, and a list of all the functions used and the # of times used.
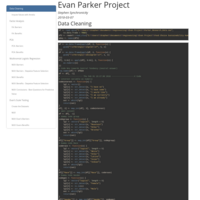
Evan Parker Analysis
This is the Statistical Analysis for Evan Parker's "Food Choices, Sustainability, and Human Health" Project
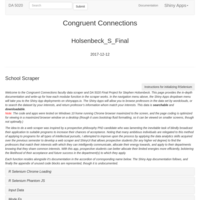
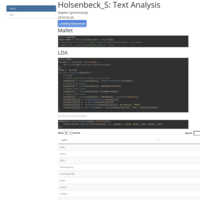
DA5020: Holsenbeck_S_Final - Congruent Connections Faculty Data Scraper
Welcome to the Congruent Connections faculty data scraper and DA 5020 Final Project for Stephen Holsenbeck. This page provides the in-depth documentation and write-up for how each modular function in the scraper works. In the navigation menu above, the Shiny Apps dropdown menu will take you to the Shiny App deployments on shinyapps.io. The Shiny Apps will allow you to browse professors in the data set by wordclouds, or to search the dataset by your interests, and return professor’s information whom match your interests. This data is searchable and downloadable.
Note: The code and apps were tested on Windows 10 home running Chrome browser maximized to the screen, and the page coding is optimized for viewing in a maximized browser window on a desktop (though it uses bootstrap fluid formatting, so it can be viewed on smaller screens, though not optimally.)
PPUA 5301 - Homework 12: Ridge, Elastic Net, and Lasso regression v Linear Regression, Simple Vector Machines (SVM) v Logistic Regression
Ridge, Elastic Net, and Lasso regression v Linear Regression
Simple Vector Machines (SVM) v Logistic Regression
Dataset on student performance
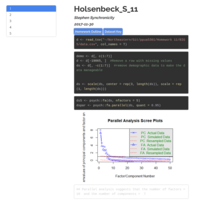
PPUA5301 - Homework 11: PCA, FA, Cluster Analyses
This homework covers Principal Component Analysis, Factor Analysis, KMeans Cluster Analysis and Hierarchical Cluster Analysis.
PPUA5301 - Homework 10: Multiple Linear Regression: Interaction Terms, Quadratic terms Binomial (logit) regression and prediction
Multiple Linear Regression:
Interaction Terms, Quadratic terms
Binomial (logit) regression and prediction
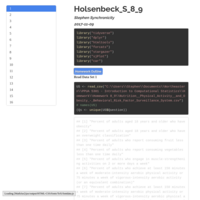
PPUA5301 - Homework 8_9: Multiple Linear Regression, Quadratic and Interaction terms, Spurious and Chained, F-Test for Nested Models
Multiple Linear Regression, Quadratic and Interaction terms, Spurious and Chained, F-Test for Nested Models
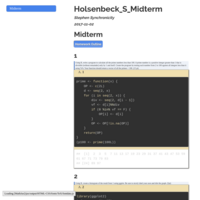
PPUA5301 - Midterm: Function Writing, Probability, Graphing, Hypothesis Testing, Chi-Squared, F-Test
Review of Function Writing, Probability, Graphing, Hypothesis Testing, Chi-Squared, F-Test
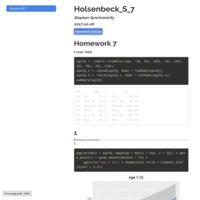
PPUA 5301 - Homework 7: Covariation, Correlation, Bivariate Regression
This is Homework 7 on Covariation, Correlation, Bivariate Regression and a t-test of the correlation.
PPUA 5301 - Homework 6: Chi-Squared & ANOVA
Chi Squared and ANOVA Tests in R
PPUA 5301 - ANOVA & Chi Squared Test
Procedural notes for how to perform ANOVA & Chi Squared test.
PPUA 5301 - Homework 5: Hypothesis Testing, T-tests
Intro to computational Statistics, Homework 5, Question 4 uses some interesting data from the GSS https://gssdataexplorer.norc.org
PPUA 5301 - Homework 4: Z-score, Conf. Intervals, Summary Statistics
Intro to Computational Statistics Homework 4
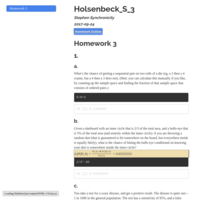
PPUA 5301 - Homework 3: Probability & LaTeX
Intro to Computational Statistics - Homework 3
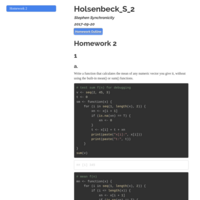
PPUA 5301 - Homework 2: Functions, Loops, Apply & Graphs
Homework 2 for PPUA 5301
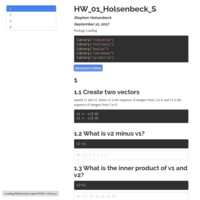
PPUA5301 - Homework 1: Base R & Latex
This is homework 1 for PPUA 5301.