
yutannihilation
yutannihilation
Recently Published
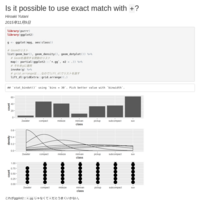
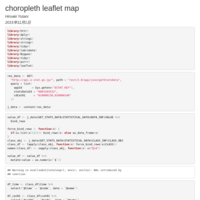
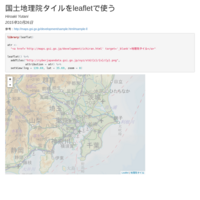
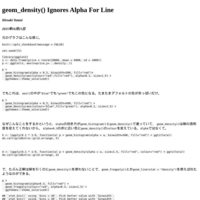
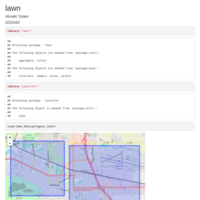
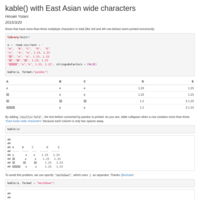
choropleth map with leaflet package
チョコ地図leaflet版
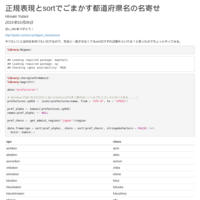
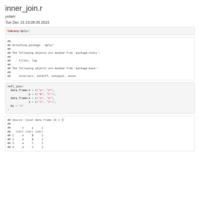
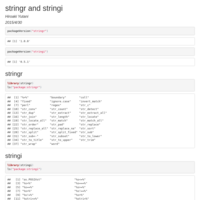
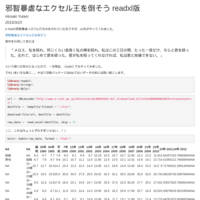
正規表現とsortでごまかす都道府県名の名寄せ
あんまり真面目にやらないバージョン。
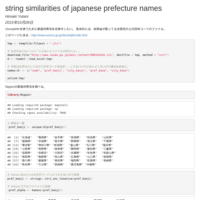
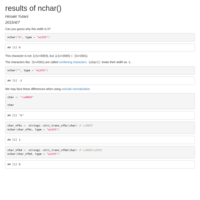
string similarities of japanese prefecture names
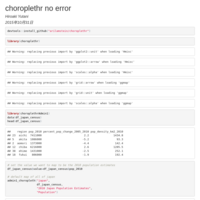
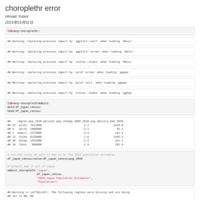
choroplethrのために都道府県名を名寄せしたい。
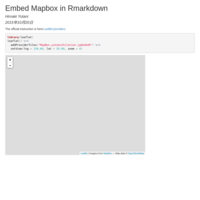
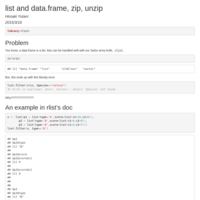
Embed Mapbox
I'm not sure if there is some way to create/edit maps of Mapbox, but at least we can embed maps.
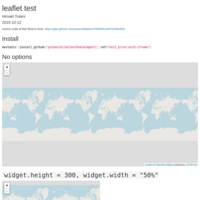
PoC: as.iframe option of htmlwidgets
If `as.iframe: true` is specified in YAML Front-matter, htmlwidgets are embedded as an iframe.
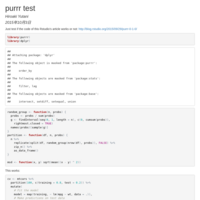
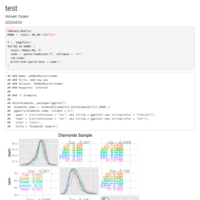
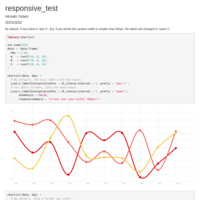
purrr test
test

osaka_age_composition
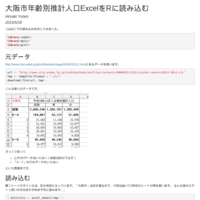
大阪市各区の年齢構成データをRで読み込む

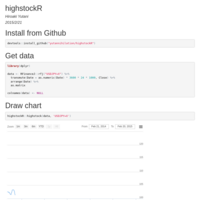
Example chart of highstockR
A demo for 46th Tokyo.R meeting
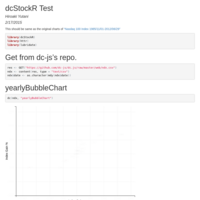

example
repo is here: https://github.com/yutannihilation/rollingsushi

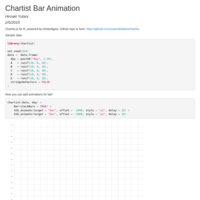
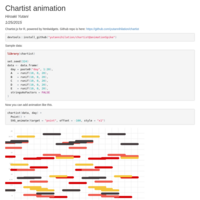
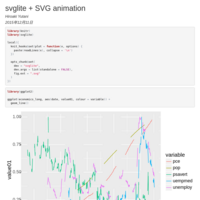
chartsist SVG animation
Here comes animations!
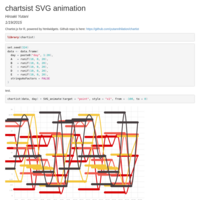

A preview of SVG_animate() feature in chartist package
This is not real.

Preview-206c6a56cd89
fix a bug
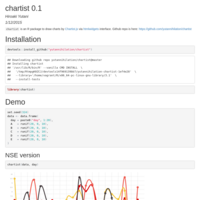
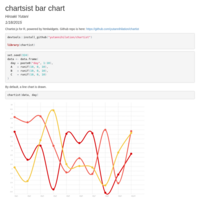
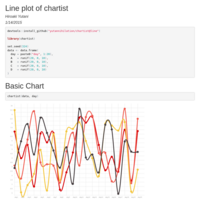
chartist 0.1
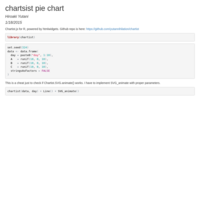
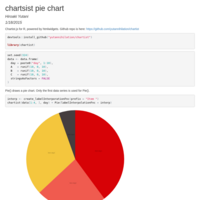
chartist is an R package to draw charts by Chartist.js via htmlwidgets interface. Github repo is here: https://github.com/yutannihilation/chartist
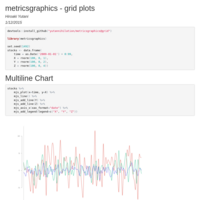
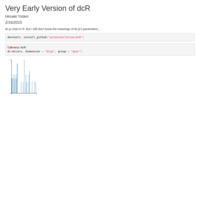
metricsgraphics - grid chart
Demo plot for pull request
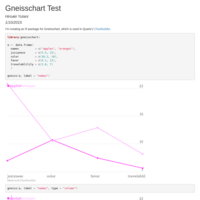
gneisschart test
The detail about Chartbuilder/Gneisschart is here: https://github.com/Quartz/Chartbuilder
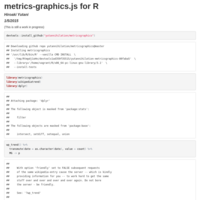
Current status of metricsgraphics package
See: https://github.com/yutannihilation/metricsgraphics
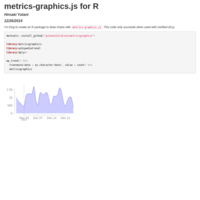
metricsgraphics with d3.js
test with minified d3.js