
apalbright
Alex Albright
Recently Published
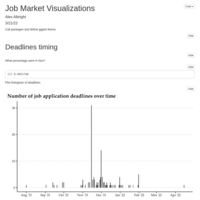
Job market visuals
Plots using data I collected on my job search
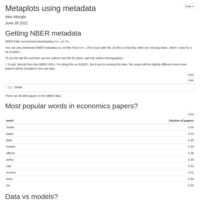
Metaplots using metadata
Exploring data on NBER working papers
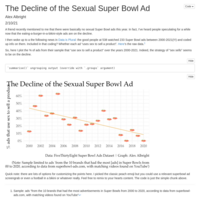
The Decline of the Sexual SuperBowl Commercial
Using new data from 538 to plot the decline of the sexual superbowl ad
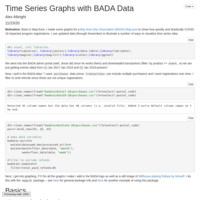
Time Series Graphs with BADA Data
I made graphs for Bay Area Disc Association to show how quickly and drastically COVID-19 impacted program registrations. This notebook shows the process behind those graphs.
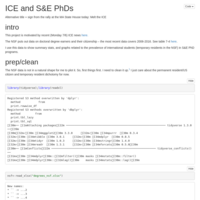
I.C.E. and Ph.D.s
After the ICE announcement last week, I decided to use NSF data to illustrate the size of the international student population across doctoral science + engineering disciplines.
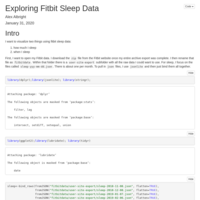
Exploring Fitbit Sleep Data
R notebook for generating visuals from a Fitbit archive export
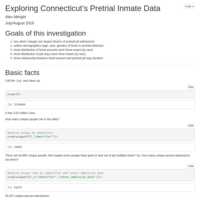
Exploring Connecticut’s Pretrial Inmate Data
R work for "Exploring Connecticut’s Pretrial Inmate Data" post
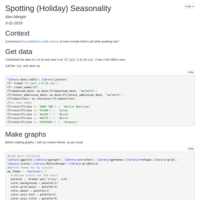
Spotting Holiday Seasonality
R notebook for "GOV 1005: Data" Demo
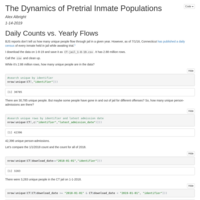
The Dynamics of Pretrial Inmate Populations
This notebook illustrates that pretrial inmate populations drop around Christmas time. It also demonstrates how static daily counts understate the magnitude of jail and pretrial systems.
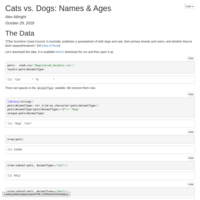
Cats vs. Dogs: Names & Ages
R notebook for exploring age and name patterns for all pets registered with Sunshine Coast Council in Australia.
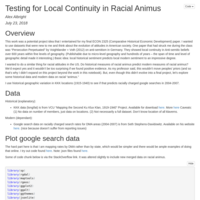
Testing for Local Continuity in Racial Animus
I wanted to empirically test for local continuity in racial animus in the US... Tracked down data on klavern locations 1915-1940 & merged with data on racially charged Google searches 2004-2007. Wasn't meant for academic paper-dom, but lives happily in the blog-sphere.
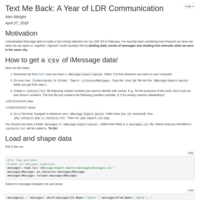
Text Me Back: A Year of LDR Communication
Turns out you can perfectly identify when my LDR SO and I are in the same city by plotting our daily iMessage frequency.
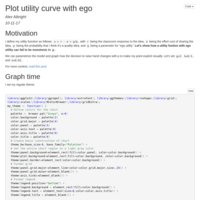
Plot utility curve with ego
Make a graph to illustrate that utility is not monotonic in parameter p.
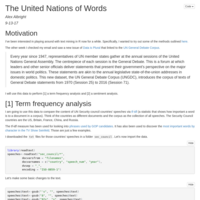
The United Nations of Words
I perform a term frequency analysis and sentiment analysis using the UN General Debate Corpus (UNGDC)
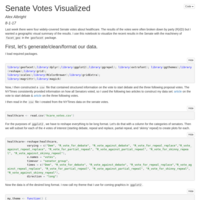
Senate Votes Visualized
I map the results of the recent Senate votes on Obamacare.
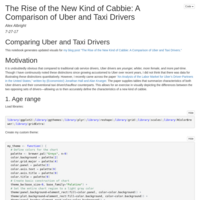
The Rise of the New Kind of Cabbie: A Comparison of Uber and Taxi Drivers
R notebook for creating visuals to compare characteristics of Uber and Taxi drivers
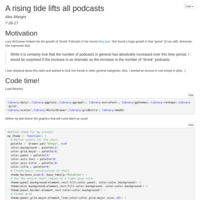
A rising tide lifts all podcasts
This notebook creates a plot to show how podcast releases have increased in 2017.
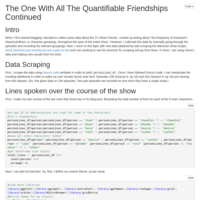
The One With All The Quantifiable Friendships, Part 2
Exploring scripts from the TV Show 'Friends'
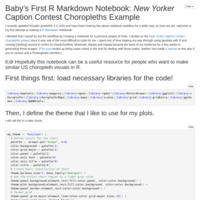
Baby's First R Markdown Notebook: New Yorker Caption Contest Choropleths
R Markdown Notebook explaining how to generate choropleths from a previously published article