Recently Published
PCA & plots
Simple demonstration of running PCA in R and generating ordination plot with eigenvector arrows and CI ellipses
ggdemo
R markdown for ggplot demo
Intro to ggplot2
For DSI Topics in R
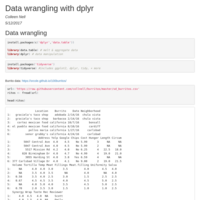
Burrito wrangling with dplyr
Rmarkdown format
dplyr
Slides for DSI 'Topics in R' workshop on data wrangling with dplyr
CAT data
Overview of some datasets of interest for CAT workshop
CAT wrangling
Data wrangling spatial data for cliamte action workshop
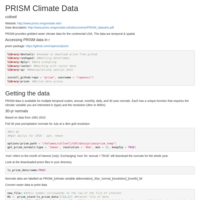
Working with PRISM data
Basics on getting data using the prism package for r.
wrangling spatial data
CAT short course demo on data wrangling + spatial data using CA endangered and threatened species
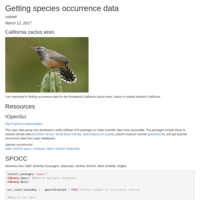
Get species occurrence data
Short walkthrough of rOpenSci spocc and rgbif packages for species occurrence data access in R.
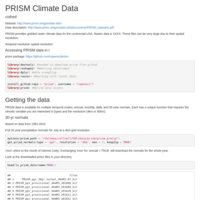
Getting PRISM data
How to get PRISM climate data in r with basic filtering & mapping.
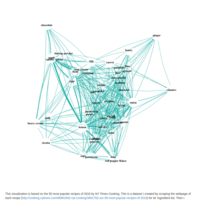
NYT cooking top ingredients
Network visualization of ingredients found commonly together in the NYTimes Cooking's top 50 recipes of 2016.
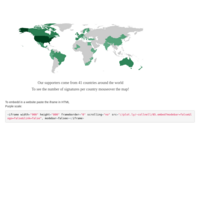
500WS_support
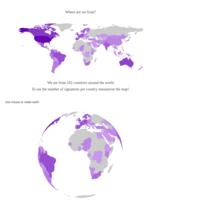
supporters of 500 women scientists
word clouds in R
simple demonstration of making a word cloud in R
geocoding
Geocoding via google API to map survey participant locations.
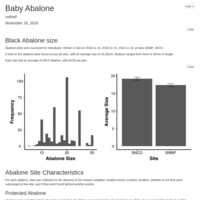
Baby Abalone
Where are all the baby abalone?
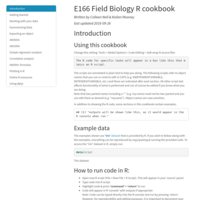
R Cookbook
R cookbook for E166 Field methods in Biology course at UCI
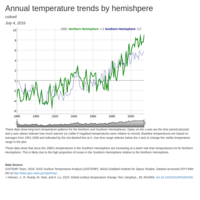
Hemisphere Temperature Trends
Interactive plot of temperature anomalies for the northern and southern hemispheres since 1880.
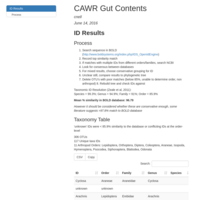
CAWR_diet
quick look at CAWR IDs
