
echarty
interactive charts in R
Recently Published

column-to-style
column-to-style feature allows binding data columns to individual item properties. Also new v.6 chart types

column-to-style
column-to-style feature allows binding data columns to individual item properties
New v.6 chart types

ecStat
ecStat plugin included in echarty

DeepSeek
DeepSeek generated code for echarty

tennis 2024
stacked bar chart of top-paid players

drill-down
An example of multi-level drill-down introduced in ECharts v5.5.0.
Navigation is implemented as bar clicks and a "Back" button.
Selecting a bar will present more data for the category, with animated transition (morphing). Hit Back button to return to previous level.

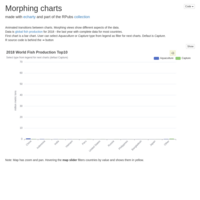
Morphing
Animated transitions between charts. Morphing views show different aspects of the data.
Hierarchical data and charts
A hierarchy tree presentation of the classic Titanic R dataset.
Tree and sunburst charts with morphing animation.
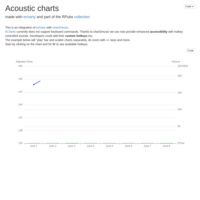
Acoustic charts
Thanks to chart2music we can now provide enhanced accessibility with hotkey controlled sounds.
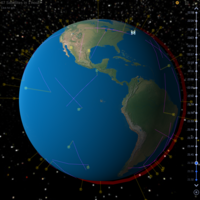
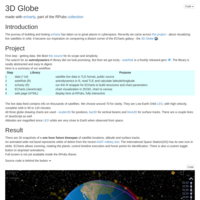
satellites on 3D Globe full-screen
see "Spacewalk with R and echarty"

Art Calendar
Calendar of museum art exhibitions
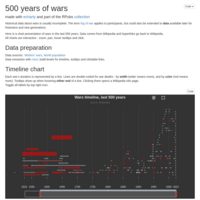
500 years of wars
Data extraction from Wikipedia, wars data shown in timeline, comparison and summary charts
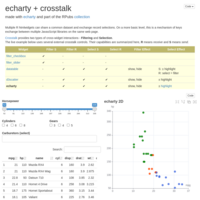
Crosstalk
echarty does crosstalk with other web controls

Gapminder data on a map using crosstalk
interactivity between different widgets that display the same data
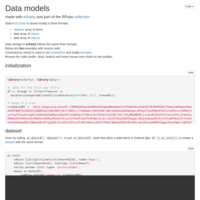
Data models
Data storage in echarty follows the ECharts format
Spacewalk with R and echarty
Interactive 3D application with ECharts 3D Globe real-time satellite data filtered by altitude charts: scatter3D for satellite location, bar3D for beams and lines3D for tracks controls: hover icons, timeline play/stop, animations toggle, zoom/rotate globe
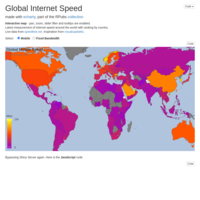
Global Internet Speed
Interactive map with pan, zoom, slider filter and tooltips. Live data from speedtest.net.
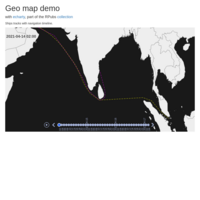
echarty geo map
Ship tracks with navigation timeline
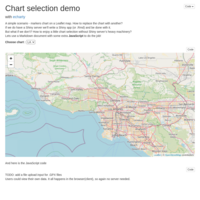
Chart selection demo
switching charts without Shiny
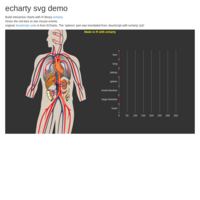
echarty svg demo
interactive charts with R library 'echarty'