Recently Published


DocumentPlotting SVG Images with ggplot2 (III)
Plotting SVG Images with ggplot2 (III)

WQD7004 Group 8
US Accidents Prediction

My Gantt Charts
making Gantt chart with R on a real-world project

Spotify
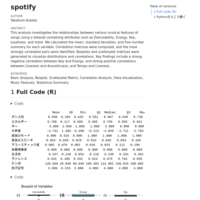
This analysis investigates the relationships between various musical features of songs using a dataset containing attributes such as Danceability, Energy, Key, Loudness, and more. We calculated the mean, standard deviation, and five-number summary for each variable. Correlation matrices were computed, and the most strongly correlated pairs were identified. Boxplots and scatterplot matrices were generated to visualize distributions and correlations. Key findings include a strong negative correlation between Key and Energy, and strong positive correlations between Liveness and Acousticness, and Tempo and Liveness.


