
riazakhan94
Md Riaz Ahmed Khan
Recently Published
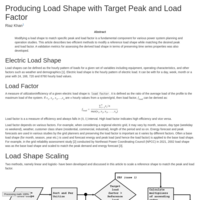
Producing Load Shape with Target Peak and Load Factor
Modifying a load shape to match specific peak and
load factor is a fundamental component for various power system
planning and operation studies. This article describes two efficient
methods to modify a reference load shape while matching the desired peak
and load factor. A validation metrics for
assessing the derived load shape in terms of preserving time series
properties was also developed.
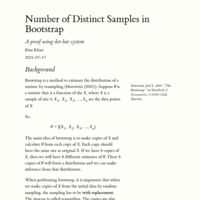
Number of Distinct Samples in Bootstrap
Bootstrap is a handy method of doing inference when parametric distribution is not available or difficult to obtain. An obvious question related to bootstrap seeks the number of distinct bootstrap samples can be drawn from an initial sample of certain size. Using a dot-bar representation, the problem takes a much simpler form and the solution can be easily obtained.
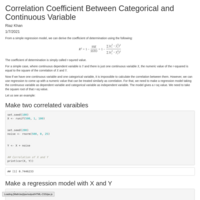
Correlation Coefficient Between Categorical and Continuous Variable
Use of regression model to come up with a number that is analogous to correlation coefficient between a continuous and categorical variable.
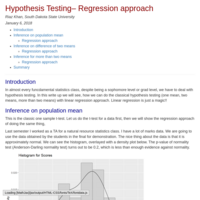
Hypothesis Testing– Regression approach
In almost every funcdamental statistics class, despite being a sophomore level or grad level, we have to deal with hypothesis testing. In this write up we will see, how we can do the classical hypothesis testing (one mean, two means, more than two means) with linear regression approach. Linear regression is just a magic!!
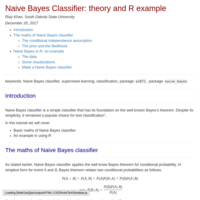
Naive Bayes Classifier: theory and R example
Naive Bayes classifier is a simple classifier that has its foundation on the well known Bayes’s theorem. Despite its simplicity, it remained a popular choice for text classification1.
In this write up we will cover
Basic maths of Naive Bayes classifier
An example in using R
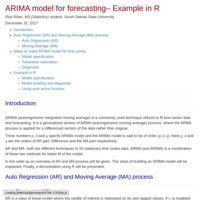
ARIMA model for forecasting– Example in R
ARIMA (autoregressive integrated moving average) is a commonly used technique utilized to fit time series data and forecasting. It is a generalized version of ARMA (autoregressive moving average) process, where the ARMA process is applied for a differenced version of the data rather than original.
Three numbers pp, dd and qq specify ARIMA model and the ARIMA model is said to be of order (p,d,q)(p,d,q). Here pp, dd and qq are the orders of AR part, Difference and the MA part respectively.
AR and MA- both are different techniques to fot stationary time series data. ARMA (and ARIMA) is a combination of these two methods for better fit of the model.
In this write up an overview of AR and MA process will be given. The steps of building an ARIMA model will be explained. Finally, a demonstration using R will be presented.

Download ODI batting record for specific batsman from http://www.espncricinfo.com/
Cricket is a game having massive following in the British Commonwealth countries, and in some other countries as well. There are several versions, one day international (ODI) is one of them. ODIs are mainly played in bilateral series and other tournaments. In the game, one team first “bat” and tally scores while the other team bowl and field. Then the teams switch roles. Whoever tally higher, is the winner.
There are certain players, who are specialized for “batting” job to make scores. These players are traditionally known as “batsman”. Batting records of batsmen can be a gold mine for a statistician/data scientist to conduct research with endless research questions. But we need the data first, before starting any analysis. ESPNcricinfo1 (also known as Cricinfo) is a website dedicated for the game of cricket. It contains news, columns, blogs, live scores, live commentary– almost everything related to the game. It hosts numerous data, player profiles, interactive insights and so on. Additionally, they have a searchable cricket statistics database (called Statsguru2) covering Tests, ODIs, Twenty20 Internationals and women’s cricket. One can submit query to pull the ODI batting data for a certain player. Different options are offered if one wants to apply any specific filter, or if one wants the data in specific format.
Here in this note, I will share how we managed to pull up-to-date records for about 100 batsmen from Statsguru. This is part of a larger project, where we are applying survival analysis to predict career milestones of certain batsmen. I wrote R codes that links up with the Statsguru query page and downloads data. I made efforts to manipulate the data so that the final product (a clean csv file) is shaped as I want.
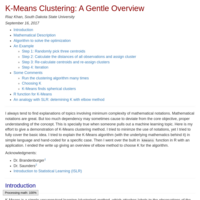
K-Means Clustering: A Gentle Overview
I always tend to find explanations of topics involving minimum complexity of mathematical notations. Mathematical notations are great. But too much dependency may sometimes cause to deviate from the core objective, proper understanding of the concept. This is specially true when someone pulls out a machine learning topic. Here is my effort to give a demonstration of K-Means clustering method. I tried to minimize the use of notations, yet I tried to fully cover the basic idea. I tried to explain the K-Means algorithm (with the underlying mathematics behind it) in simple language and hand-coded for a specific case. Then I went over the built in kmeans function in R with an application. I ended the write up giving an overview of elbow method to choose K for the algorithm.
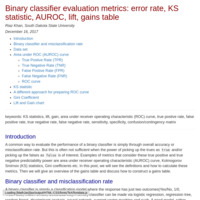
Binary classifier evaluation metrics: error rate, KS statistic, AUROC, lift, gains table
A common way to evaluate the performance of a binary classifier is simply through overall accuracy or misclassification rate. But this is often not sufficient when the power of picking up the trues as true and/or picking up the falses as false is of interest. Examples of metrics that consider these true positive and true negative predictability power are area under receiver operating characteristic (AUROC) curve, Kolmogorov Smirnov (KS) statistics, Gini coefficients etc. In this post, we will see the definitions and how to calculate these metrics. Then we will give an overview of the gains table and discuss how to construct a gains table.
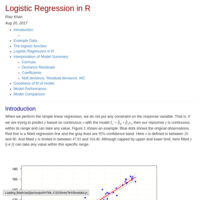
Logistic Regression in R
Notes on logistic regression. Background of the logistic function. Implementation of logistic regression in R. Interpretation of model summary: Explanation of Coefficients, Null deviance, Residual deviance, AIC. Goodness of fit of logistic model with Hosmer–Lemeshow test. Description of model performance metrics such as accuracy, true positive rate, false positive rate. Demonstration of validation set approach.
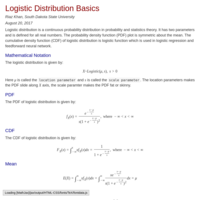
Logistics Distribution Basics
Mathematical notation, mean, variance, shape of logistic distribution. R code for implementation
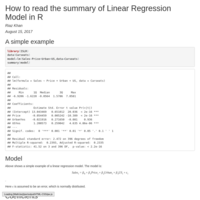
Interpret the summary of Linear Regression Model in R
Understanding the summary statistics of linear regression model in R
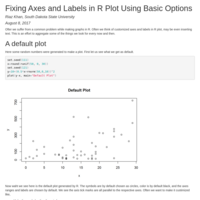
Fixing Axes and Labels in R Plot Using Basic Options
Often we suffer from a common problem while making graphs in R. Often we think of customized axes and labels in R plot, may be even inserting text. This is an effort to aggregate some of the things we look for every now and then.

Fixing Axes and Labels in R plot using basic options
Often, we suffer from a common problem while making graphs in R. Often we think of customized axes and labels in R plot, may be even inserting text. This is an effort to aggregate some of the things we look for every now and then.