Recently Published
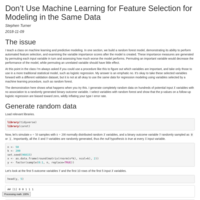
Don't Use Machine Learning for Feature Selection for Modeling in the Same Data
I teach a class on machine learning and predictive modeling. In one section, we build a random forest model, demonstrating its ability to perform automated feature selection, and examining the variable importance scores after the model is created. These importance measures are generated by permuting each input variable in turn and assessing how much worse the model performs. Permuting an important variable would decrease the performance of the model, while permuting an unrelated variable should have little effect.
At this point in the class I'm always asked if you could use a procedure like this to figure out which variables are important, and take only those to use in a more traditional statistical model, such as logistic regression. My answer is an emphatic _no_. It's okay to take these selected variables forward with a different validation dataset, but it is not at all okay to use the _same data_ for regression modeling using variables selected by a machine learning procedure, such as random forest.
The demonstration here shows what happens when you try this. I generate completely random data on hundreds of potential input $X$ variables with no association to a randomly generated binary outcome variable. I select variables with random forest and show that the p-values on a follow-up logistic regression are biased toward zero, wildly inflating your type I error rate.
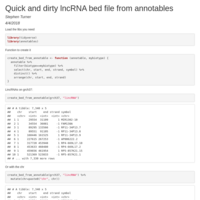
Quick and dirty lncRNA bed file from annotables
Quick and dirty lncRNA bed file from annotables
rmarkdown clas thriv
asdfasdf
hsl rmarkdown class nov 6
hsl rmarkdown class nov 6
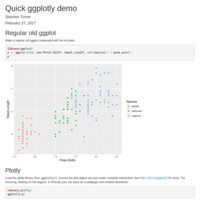
Quick ggplotly demo
Quick ggplotly demo
RStudio::conf RMarkdown Tutorial
These are some random notes from a two hour tutorial on advanced RMarkdown given by Yihui Xie on January 14, 2017 at the RStudio conference
DESeq2 post analysis plots of expression values with a multipage PDF catalog
I get asked all the time, "hey, could you make a boxplot of the expression values of _SomeGene_ for me?" The `plotCounts()` function in DESeq will do this, but only one gene at a time. This shows you how to do this for any arbitrary number of genes in your data (or all of them!). You can plot a small number in a single plot with facets, or you could plot a large number in a text-searchable multi-page PDF.
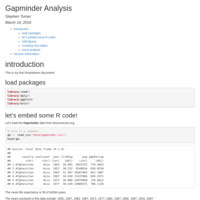
bims 8382 gapminder analysis
bims 8382 gapminder analysis
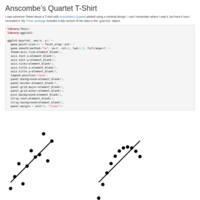
Anscombe’s Quartet T-Shirt
I saw someone Tweet about a T-shirt with Anscombe’s Quartet plotted using a minimal design. I can’t remember where I saw it, but here’s how I recreated it. My Tmisc package includes a tidy version of the data in the quartet object.
Embedding an RMarkdown chunk literally in an RMarkdown document
Embedding an RMarkdown chunk literally in an RMarkdown document
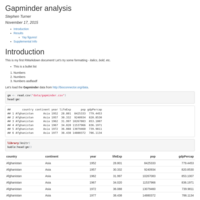
Gapminder analysis from class
This is the analysis we just did
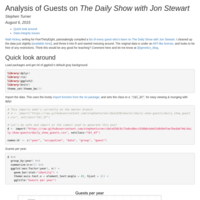
Analysis of Guests on The Daily Show with Jon Stewart
Quick analysis of all the guests who've ever been on The Daily Show with Jon Stewart, using data from FiveThirtyEight
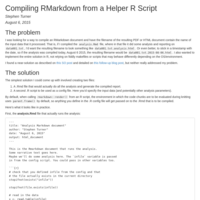
Compiling RMarkdown from a Helper R Script
Demonstrates how to compile a .Rmd from a helper .R script. Useful, for example, if you wanted to use a config.R script to define parameters to be used in the main analysis.Rmd file, and have the resulting compiled report contain the name of the input files used in the analysis.
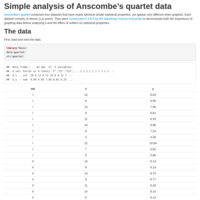
Simple analysis of Anscombe's Quartet data
Simple analysis of Anscombe's Quartet data
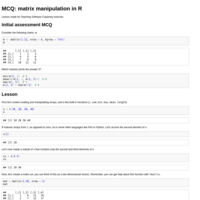
MCQ: matrix manipulation in R
Lesson made for Teaching Software Carpentry exercise.
