
zubairishaq9
Data Analysis wtih Rstudio
Recently Published

Unlocking Data Insights with the cor() Function in R
Transform Your Data Analysis Today! Learn how to harness the power of the cor function in R to uncover clear, actionable insights from your datasets. Our article simplifies complex concepts like Pearson, Spearman, and Kendall correlation coefficients, and shows you how to build and interpret correlation matrices effortlessly. Imagine making confident, data-driven decisions with ease! This month, we offer a free exploratory data analysis and a 10% discount on our expert services. Plus, with our full refund guarantee, you risk nothing. Don’t wait—book your free call now and partner with RStudioDatalab to beat deadlines with expert support!

Levene Test in R
"Master the Levene Test in R to validate variance homogeneity for ANOVA, t-tests, and regression. A step-by-step guide with R code, outlier detection, and visualization tips to ensure robust statistical analysis.

How to Perform a Wald Test in R | wald.test function in R
This comprehensive guide features examples and detailed explanations for performing a Wald test in R. It will help you effectively analyze coefficients.
https://www.rstudiodatalab.com/2024/11/how-to-perform-wald-test-in-r-waldtest.html

How to Create and Customize a Volcano Plot in R
Volcano plots are essential tools in bioinformatics, widely used for visualizing gene expression data, especially when identifying significant changes across conditions. This article provides a complete guide on creating and customizing volcano plots in R, from setting up your R environment to performing differential expression analysis. With a step-by-step approach and code examples, we’ll walk through everything needed to produce professional-quality plots that reveal meaningful patterns in your data.

How to Use prop.table function in R
prop tables in R have emerged as a powerful tool for uncovering insights from categorical data. If you're a data analyst, R programmer, or data science enthusiast, understanding and utilizing prop tables can greatly enhance the depth and clarity of your data analysis.

How to Perform and Interpret the Shapiro-Wilk Test in R
Ensuring your data fits a normal distribution is crucial for many statistical analyses. The Shapiro Wilk test in R is a powerful tool to check for normality. Let’s walk through how to perform and interpret this test using the mtcars dataset.

read.table in R: A Comprehensive Guide Using the mtcars Dataset
Learn how to use the read.table function in R with the mtcars dataset. This detailed guide covers everything you need to know about reading and manipulating data in R using read.table.
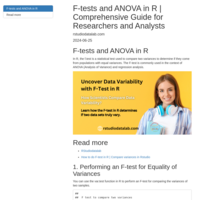
F-tests and ANOVA in R: A Comprehensive Guide for Researchers and Analysts
Discover how to perform F-tests and ANOVA in R with our step-by-step guide. Learn about one-way ANOVA, two-way ANOVA, repeated measures ANOVA, and more, with practical examples and expert tips for handling assumptions and reporting results.
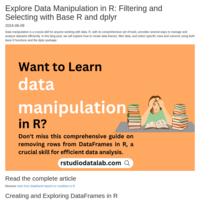
Explore Data Manipulation in R: Filtering and Selecting with Base R and dplyr
Learn how to manipulate and filter datasets in R using both base R and the powerful dplyr package. This guide covers essential data frame operations for beginners.
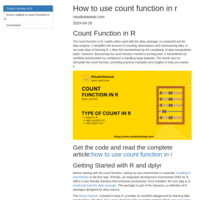
How to use count function in r
Learn the count function in R with our detailed guide by RStuidoDataLab. Learn practical examples and advanced techniques, and enhance your data analysis skills using dplyr. Visit our site for expert tutorials and personalized data solutions.
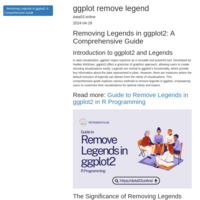
Removing Legends in ggplot2: A Comprehensive Guide
Legends are central to ggplot2’s functionality, which provides key information about the data represented in plots.
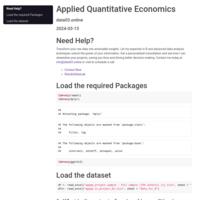
Applied Quantitative Economics
With these considerations in mind, the aim of Project 1 is to study and answer the
following three questions:
1. What is the extent of regional inequalities in expenditure by secondary schools?
2. What has been the recent evolution of total gross expenditure by secondary schools?
3. What are the determinants of secondary school expenditure?
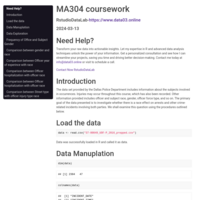
coursework for MA304
The coursework involves working individually on the dataset 37-00049_UOF-P_2016_prepped. The source of this data is available at https://www.kaggle.com/center-for-policing-equity/data-science-for-good.
You are tasked to provide an analysis of a policing dataset from Dallas, Texas in 2016.
Your final report will be in HTML format generated using Rmarkdown and consist of a full data analysis, interpretation of the findings, including data visualisations.
Level 7 reports will include advanced graphics such as interactive plots. The use of interactive plots is optional for level 6 students.
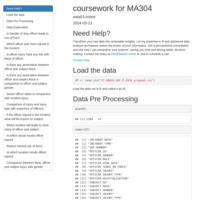
Coursework for MA304
The coursework involves working individually on the dataset 37-00049_UOF-P_2016_prepped. The source of this data is available at https://www.kaggle.com/center-for-policing-equity/data-science-for-good.
You are tasked to provide an analysis of a policing dataset from Dallas, Texas in 2016.
Your final report will be in HTML format generated using Rmarkdown and consist of a full data analysis, interpretation of the findings, including data visualisations.
Level 7 reports will include advanced graphics such as interactive plots. The use of interactive plots is optional for level 6 students.
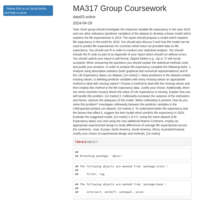
MA317 Group Coursework
Suppose you work as a data analyst for an insurance company. You are asked to analyse a dataset of the World Development Indicators (WDI), which are derived from a primary World Bank database for development data from officially-recognized international sources. The dataset is available via moodle.
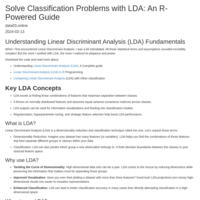
Transform Your Data with LDA: Dimensionality Reduction & Classification Techniques in R
Supercharge your analysis! Optimize and interpret LDA models, uncover hidden patterns, and learn how LDA prepares data for advanced tasks.
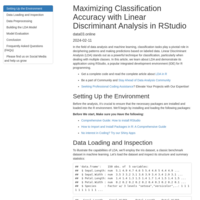
Maximizing Classification Accuracy with Linear Discriminant Analysis in RStudio
Linear Discriminant Analysis (LDA) using RStudio to optimize classification accuracy. This comprehensive guide walks you through building, evaluating, and interpreting LDA models with real-world examples from the Iris dataset.
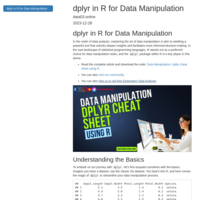
Data Manipulation with dplyr in R: A Comprehensive Guide for Efficient Analysis
Explore the world of data manipulation with dplyr in R. Learn essential functions, advanced techniques, and real-world applications. Elevate your statistical analysis skills effortlessly. Explore our guide now!
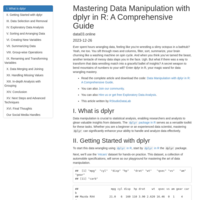
Data Manipulation with dplyr in R: A Comprehensive Guide
Unlock the power of data manipulation with dplyr in R! Dive into the intricacies of data selection, exploration, and transformation. This comprehensive guide promises a journey through practical applications and real-world insights.
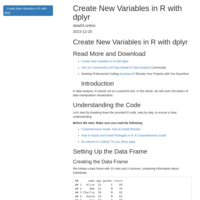
Create New Variables in R with dplyr
mutate is one of the main functions of dplyr, and it allows you to create new variables or modify existing variables in a data frame or a tibble. You can use mutate to perform various operations on your data, such as calculations, transformations, conditions, combinations, etc. mutate also works well with other dplyr functions, such as group_by, summarise, filter, arrange, etc.
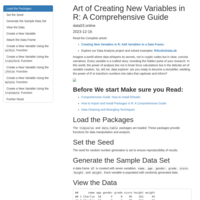
Creating New Variables in R: A Comprehensive Guide
Imagine a world where data whispers its secrets, not in cryptic codes but in clear, concise narratives. Every variable is a crafted story, revealing the hidden pulse of your research. In this world, the power of analysis lies not in brute force calculations but in the delicate art of variable creation. So, tell me, data explorer: are you ready to become a storyteller, wielding the power of R to transform numbers into tales that captivate and inform?
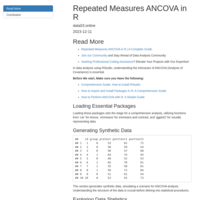
Repeated Measures ANCOVA in R
The repeated measures ANCOVA in R tests whether the average values of one or more variables measured repeatedly on the same subjects differ significantly after adjusting for a covariate.
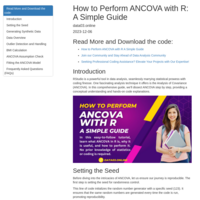
ANCOVA with R in 5 simple steps
Do you want to learn how to perform ANCOVA in R. It is simple and powerful statistical method that can help you compare the means of a continuous variable across different groups while considering the effects of other variables that may influence the outcome? If so, you should check out my latest article, where I show you ANCOVA, why it is useful, and how to perform it with R using the aov() function or the Anova() function. I will also show you how to prepare your data for ANCOVA, interpret and report the results of ANCOVA, and create and customize plots to visualize the ANCOVA model and the effects of the variables.
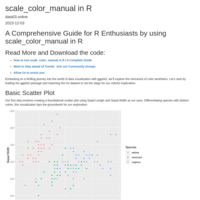
A Comprehensive Guide for R Enthusiasts by using scale_color_manual in R
Learn to use scale_color_manual in R to create custom color scales for your plots. This guide will explain the concepts, benefits, and best practices.

How I Use scale_fill_gradient in R: A Guide with Examples
Learn how to use scale_fill_gradient in R to create stunning color gradients for your plots. Step-by-step tutorial with practical examples and tips.
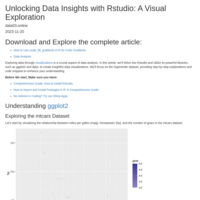
Unlocking Data Insights with Rstudio: A Visual Exploration
Learn how to use scale_fill_gradient2 in R to create beautiful plots with different colors for different values. Apply it to various types of plots.
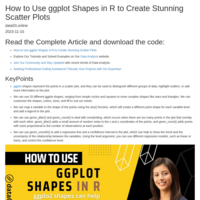
ggplot Shapes in R to Create Stunning Scatter Plots
Learn to use ggplot shapes in R to create beautiful and informative scatter plots with different point shapes, colors, sizes, and fills.
How I Learned to Create Stunning Data Visualization in R
In this article, I will share my learning journey of Data Visualization in R and the use of ggplot2 to create amazing plots with minimal code.

Exploratory Data Analysis for International Journals I PhD Insight
Learn how to perform exploratory data analysis in R and how it can help you prepare your data for international journal publication.
Secrets of R Contingency Table Revealed: A PhD’s Experience
Learn how I create and interpret a contingency table in R, a useful tool for analysing the relationship between two or more categorical variables.
Exploring R Date Format Complexities: My Doctoral Insights
Learn how the R date format works. Discover how to convert strings to dates, manipulate dates and calculate date differences.
How to Calculate Confidence Intervals in R?
Learn how to calculate confidence intervals in R with this comprehensive guide
How to Count the Number of Words in a String Using R?
Learn how to count the number of words in a string using R, Tidyverse. This tutorial provides code examples and explains the function step-by-step.
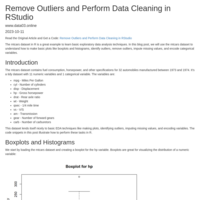
Remove Outliers and Perform Data Cleaning in RStudio
Outliers and data cleaning for data science. Outliers differ from dataset and affect statistics. Data cleaning removes errors and missing values
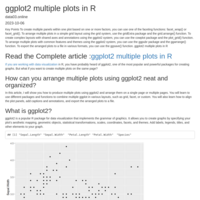
ggplot2 multiple plots in R
Learn to combine multiple ggplots into a single plot using the facet functions in ggplot2 and the ggpubr package.
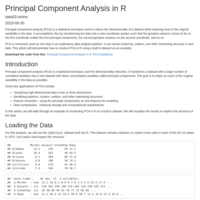
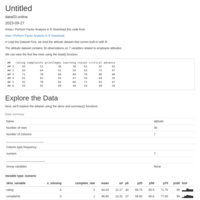
Principal Component Analysis in R -PCA Explained
Principal Component Analysis in R and how it can be used for dimensionality reduction and data visualization. Explore step-by-step examples and techniques.
How I Perform Factor Analysis in R
Factor analysis is a statistical method that can help us understand the underlying structure of a set of variables. It can reduce the complexity of data by finding a smaller number of latent factors that explain the variation in the observed variables. In this article, I will show you how I chose to perform R-factor analysis, using an example dataset and some useful packages and functions.
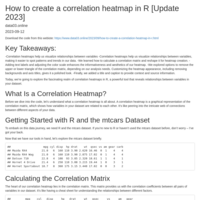
How to create a correlation heatmap in R [Update 2023]
Unlock the Power of Data Analysis with R: A Step-by-Step Guide to Creating Stunning Correlation Heatmaps. Discover how to visualize relationships in your data and gain insights like a pro. Dive into data analysis with Zubair Goraya, your trusted expert. Read now!
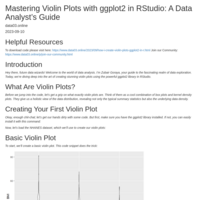
How I Create Violin Plots with ggplot2 in R
Learn how to create violin plots with ggplot2 in R. Violin plots are a type of graphical display that shows the distribution of a continuous variable
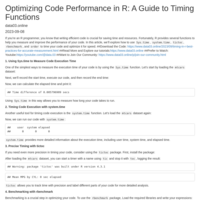
Timing in R: Best Practices for Accurate Measurements
Discover the secrets of optimizing your R code! Learn how to measure execution time, use benchmarking tools, and sort data efficiently. Watch our 2-minute video tutorial and supercharge your programming skills today!
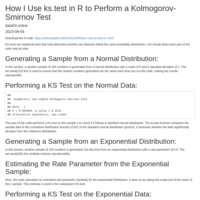
How I Use ks.test in R to Perform a Kolmogorov-Smirnov Test
Learn how to use the ks.test function in R to compare cumulative distribution functions of samples using the Kolmogorov-Smirnov test.
https://www.data03.online/sitemap.xml
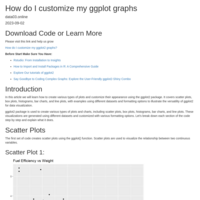
Learn how to center the title and remove the legend in your ggplot2 plots with this easy tutorial. You’ll also see some examples of different types.
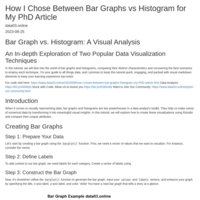
How I Chose Between Bar Graphs vs Histogram for My PhD Article
Dive into data visualization with bar graphs and histograms in Rstudio. Learn how to create captivating visuals and choose the right technique for your data insights.
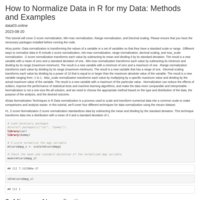
How to Normalize Data in R for my Data: Methods and Examples
Learn how to normalize data in R using different methods and scenarios. In this article will show you how to use the scale, normalize data.
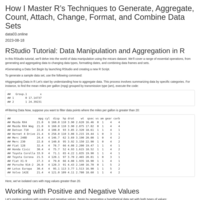
How I Master R's Techniques to Generate, Aggregate, Count, Attach, Change, Format, and Combine Data Sets
Discover how to effectively Generate, Aggregate, Count, Attach, Change, Format, and Combine Data Sets
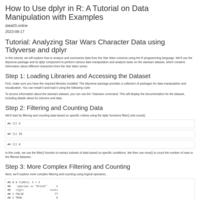
How to Use dplyr in R: A Tutorial on Data Manipulation with Examples
Learn data manipulation in R using dplyr! Step-by-step tutorial with practical examples for effective data analysis. Boost your skills today!
Dplyr is a package that provides a grammar of data manipulation in R, consisting of verbs that help you perform everyday data manipulation tasks.
You can use dplyr to count values that meet certain conditions, find descriptive statistics, apply functions to each data frame row, and join two tables.
You can install and load dplyr with install.packages("dplyr") and library(dplyr).
You can chain multiple dplyr functions using the pipe operator %>%, which reads as "then".
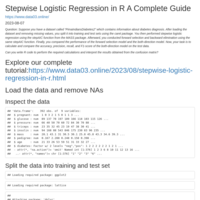
Stepwise Logistic Regression in R: A Complete Guide
Stepwise logistic regression is a variable selection technique that aims to find the optimal subset of predictors for a logistic regression model.
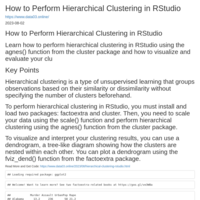
How to Perform Hierarchical Clustering in RStudio
Key Points
Hierarchical clustering is a type of unsupervised learning that groups observations based on their similarity or dissimilarity without specifying the number of clusters beforehand.
To perform hierarchical clustering in RStudio, you must install and load two packages: factoextra and cluster. Then, you need to scale your data using the scale() function and perform hierarchical clustering using the agnes() function from the cluster package.
To visualize and interpret your clustering results, you can use a dendrogram, a tree-like diagram showing how the clusters are nested within each other. You can plot a dendrogram using the fviz_dend() function from the factoextra package.
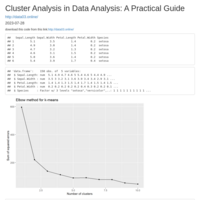
Cluster Analysis in Data Analysis: A Practical Guide
Learn what is cluster analysis in data mining, why it is useful, what are the main types and methods of cluster analysis, what are some examples and applications of cluster analysis in different domains, and how to use RStudio to perform cluster analysis
Tutorial: Data Analysis and Regression in R
In this tutorial, we will walk through data analysis, data preprocessing, and regression using R. We will work with a dataset named "dataoutliers.csv," which contains information related to insurance charges.