
datanotebook
ifeanyi malu
Recently Published
HTML
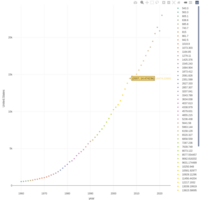
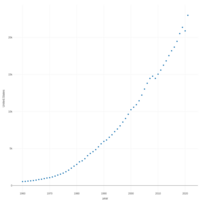
The United States GDP from 1960-2021
HTML
The GDP of China and the United States: 1960-2021
HTML
United States GDP from 1960 to 2021

HTML
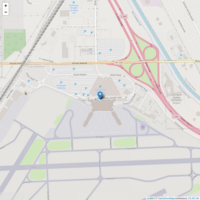
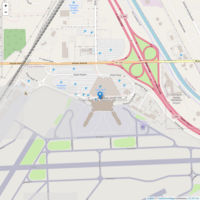
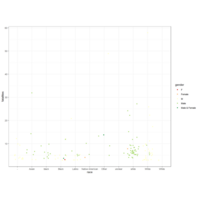
my map created with Leaflet
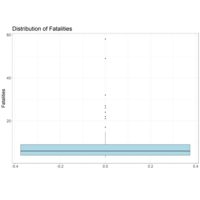
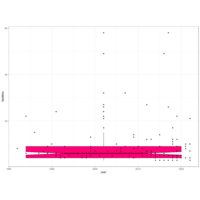
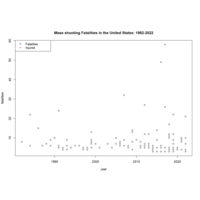
Plot-Mass shooting(Fatalities versus injured)
Hodgepodge: Regression models
Data source: www.motherjones.com
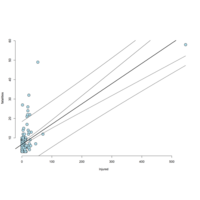
Plot-Mass shooting(Fatalities versus injured)
Plotting the prediction intervals
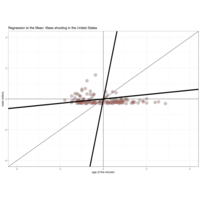
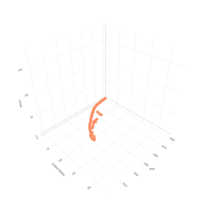
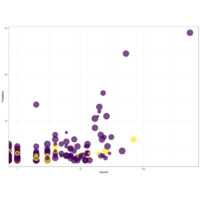
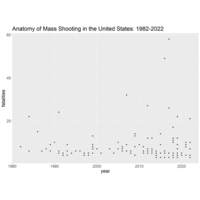
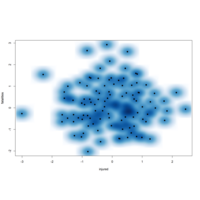
Plot-Mass shooting(Age of the shooter versus total victims)
Total victims Vs. age of the shooter
data source: www.motherjones.com
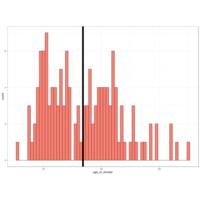
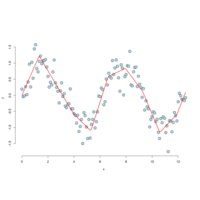
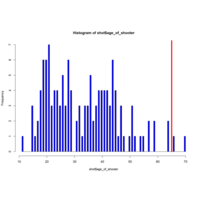
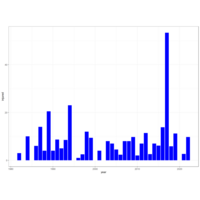
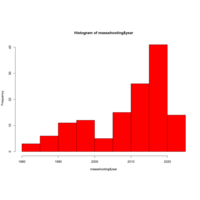
Plot-Mass shooting(Age of the shooter)
The least squares estimate is the empirical mean
Data source: motherjones.com
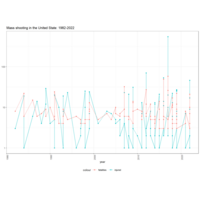
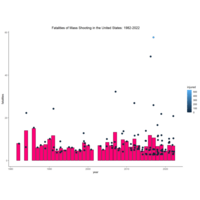
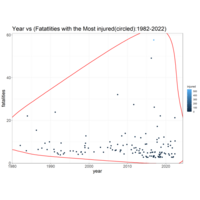
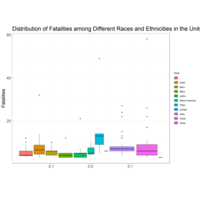
Mass shooting in the United States: 1982-2022
This data visualization captured the fatalities and injuries sustained during the bloodbath. This database from Mother Jones initially covered mass shooting cases from 1982 to 2012 and has been revised and expanded numerous times. For a starter, this data did not cover all mass shootings in the United States.
Data source: https://www.motherjones.com/politics/2012/12/mass-shootings-mother-jones-full-data/

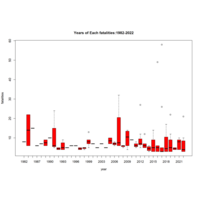
Mass shooting in the United States: 1982-2022
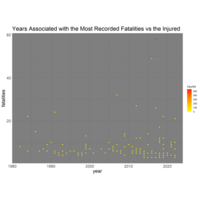
Year Vs. Fatalities
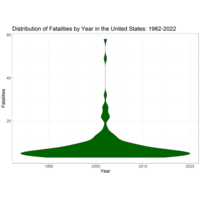
Mass shooting in the United States: 1982-2022
Purpose: The study's main goal is to visualize the anatomy of mass shootings in the United States.
Method and Analysis:
The CSV data for the study was taken from the Mother Jones website, exported to r studio, and analyzed. R programming software was used for data wrangling/manipulations and analysis.
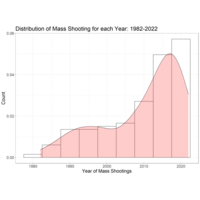
Mass shooting in the United States: 1982-2022
The year with the most shootings
Mass shooting in the United States: 1982-2022
Results:
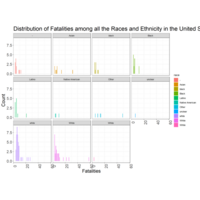
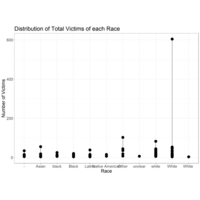
According to the data, the highest fatalities were recorded on 10/01/2017, when 58 people were killed. The data indicate that 546 individuals were injured and 604 were victims. The shooter's age was 60, and most weapons used were legally obtained. The data suggest that the shooter were mostly white male.
Next steps:
The data visualization will help policymakers and stakeholders implement policies to deter individuals from using guns to maim and kill, improve mental health programs, tighten background checks, improve law enforcement, and increase educational awareness.
Conclusions:
Although this dataset did not cover all mass shootings, it shines a light on the epidemic of mass shootings in the United States.
Further readings:
https://www.motherjones.com/topics/guns/

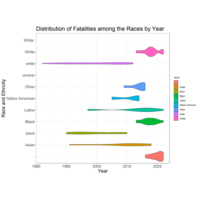
Mass shooting in the United States: 1982-2022
Data source: https://www.motherjones.com/politics/2012/12/mass-shootings-mother-jones-full-data/
Further readings
https://www.motherjones.com/topics/guns/