Recently Published
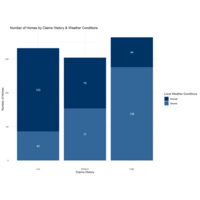
Number of Homes by Claims History and Weather Conditions
This is a plot from the MERA Insurance example using R and ggplot to create a bar chart. The data is synthetic and used as part of an exercise to illustrate using R, Python and Power BI for Data Visualization.

Prowrite: final evaluation
Analysis and results of the final evaluation of prowrite


Elecciones Ixmiquilpan
Gráficas sobre los voos obtenidos por los partidos políticos


Plot
aa


Spotify API Rstudio Tutorial
A quick and simple description how to set up an account in Spotify's API and how to use it in R