
juanhklopper
Dr Juan H Klopper
Recently Published
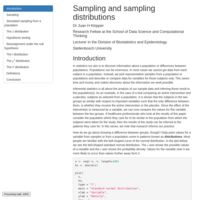
Sampling and sampling distributions
In this R markdown file I consider sampling and sampling distributions and show how randomisation under the null hypothesis can help us understand how likely a test statistics such as the difference in means between two groups is given sample data.

Odds ratio and confidence intervals
Calculating odds, odds ratios, and the confidence intervals for odds ratios using bootstrapping.

Astra Zeneca efficacy SARS-CoV-2 vaccine trial on healthy individuals in SA
Replicating the results of the Astra-Zeneca SARS-CoV-2 vaccine trial in South Africa. This small trial recruited (relatively) young, healthy individuals. The outcome showed poor efficacy and lead to the discontinuation of the use of the vaccine in South Africa.

Uncertainty in relative risk
Calculating confidence intervals for relative risk

JHU coronavirus analysis end 2020
A short notebook on analysing coronavirus data fro the JHU dataset. Considering what lies ahead for RSA in 2021.
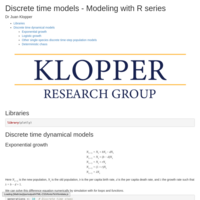
Discrete time series modeling - Modeling with R series
In this publication we take a look at modeling in discrete time steps. It is part of a series showing modeling using R.
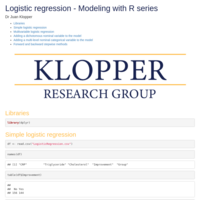
Logistic regression - Modeling with R series
In this publication we look at logistic regression. It is part of a series showing modeling using R.
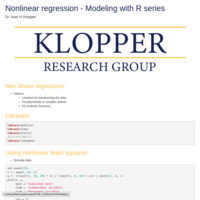
Nonlinear modeling - Modeling with R series
In this publication we take a look at nonlinear modeling. It is part of a series showing modeling using R.

Plotting - Modeling with R series
In this publication we take a look at plotting data. It is part of a series showing modeling using R.
Statistics using the tidyverse - Modeling with R series
In this publication we take a look at conducting basic statistical analysis using the R language. It is part of a series showing modeling using R.
Introduction to R - Modeling with R series
This publication introduces you to the R language. It is part of a series showing modeling using R.

Predicted skin lesion images
How to batch images from your local drive using image data generation.
Simple gradient descent
This tutorial gives an intuitive view of gradient descent (finding the minimum of a function) by way of the simple case of a parabola in one variable.

Working with data
Importing spreadsheet files and manipulating data with dplyr.

Introduction to R and RStudio
The first lecture in my new course on medical statistic for residents (specialist in training) in the Health Sciences Faculty of the University of Cape Town. Lectures are held on a Tuesday evening and repeated on a Thursday evening.

Forcats library for categorical variables
This document looks at managing categorical variables in a dataset. In base R, these are seen as factors. Not so in the tidyverse, which creates tibbles instead of dataframes. The forcats library allows us to make use the advantages of factors in the tidyverse.

Box-and-whisker plots
In this tutorial we take a look at the ubiquitous box-and-whisker plot. It is ideal to visualize the spread in a numerical variable by way of quartile values. It can also display statistical outliers which can be great importance.

Adding color to Plotly plots
In this tutorial we take a look at all the color options available in Plotly for R. You can indeed color your plots and charts to your heart's content.

Control color in histograms using Plotly for R
In this tutorial we add some control over the color of our histograms. It is an extension of a previous tutorial on histograms.

G tests for categorical variables
In this tutorial we explore alternative tests for categorical variables.

Tests for categorical variables
In this tutorial we take a look at the most common tests to analyze categorical variables.
Exact test of goodness of fit
In this tutorial we take a look at the exact test of goodness of fit for binomial categorical variables. This hypothesis test compares the actual counts found during data capture against an expected count.

Multivariate comparison of the means of two groups
This tutorials explains the nature and use of Hotelling's T-squared test to compare the means of several numerical variables between two groups. Along the way we also consider some of the assumptions for the use of this test and look at the packages and functions required for the test.

Introducing R for biostatistics
Accompanying RPubs file for my YouTube tutorial introducing R for biostatistics.
Example of a convolutional neural network
This document contains a first look at an example of a convolutional neural network. It uses one of the built-in Keras image datasets and shows the use of convolutional operation layers, maximum pooling layers, and a flatten layer.

Introduction to convolutional neural networks
Convolutional neural networks (CNN) are ideal for image classification. This post provides an explanation of the concepts required to construct a CNN. These include the convolution operation, pooling, stride length, padding, and more.

Cross entropy
Cross entropy describes a method for determining the difference between an actual and a predicted categorical data point value.
Deep neural networks for regression problems
Regression problems have numerical data as target variable and requires specific loss functions and output layer design.
Improvement techniques in neural network training
Researchers have added many mathematical changes to the original concept of a layered perceptron model. This chapter discusses some of these improvements and are aimed at providing an overview of this topic. This will be useful when implementing techniques such as RMSprop and batch normalization in code.
Implementing regularization and dropout in Keras
This chapter implements regularization and dropout to help overfitting (high variance). The IMDB dataset is used as a prime example of high variance, especially when large networks are used.

Dropout regularization
Dropout is a regularization technique that can be implemented when a network overfits (i.e. a high variance exists). It randomly removes the values of some nodes in a network leading to a simpler model and hence reduces the hypothesis space.

Regularization
This document describes the use of regularization in deep neural network. Regularization is introduced as a form of complexity measurement and constrain on the hypothesis space of a network. Regularization constrains the hypothesis space by creating simpler networks that generalize better and improve high variance.
Poor performance of a deep learning model
This post discusses the issues around creating a proper training and test set. It also discusses the subjects of bias and variance in a model, showing how these are recognized and what steps to take to correct for them.
Example of a deep neural network using Keras
This chapter shows the actual code to construct a neural network using Keras in R. It introduces the concept of splitting the data into a training and test set. This allows for both training the neural network as well as testing its accuracy.

R Primer
A very short introduction to R

Basic neural network
This post describes the basics of a neural network
Logistic regression as a single layer network
The last puzzle piece required to understand the fundamentals of deep neural networks is introduced in this post. It considers expressing the predicted variable as a probability so that it can be used in classification problems.
Multiple linear regression as a shallow network
This chapter describes a multivariable linear regression model as a neural network with a single hidden layer. This is done so as to create a familiarity with the terms and processes of deep learning.
Linear regression as a simple learning network
An example of linear regression serves to illustrate the basic concepts of deep learning through the explanation of terms such as cost functions, backpropagation, global minima, and gradient descent.
Regression as a first step in understanding deep learning
This post explains the concepts of a model and an error through the use of linear regression. These concepts will play an important role in creating deep neural networks.

Introducing Keras for deep learning
This post introduces Keras in R. A deep learning framework using Google's TensorFlow backend.
The example is a multi-class classification problem from the University of California at Irvine database for machine learning. The dataset is converted to a .csv file and is available in my GitHub repository.
Class imbalance
This post describes the ROSE package used to correct for class imbalance.

Maternal mortality using World Bank Open Data
This R-markdown post introduces the WDI library to interact with the World Bank Open Data API.
Working with bivariate data in R
Describing the expression and visualization of bivariate categorical and numerical variables.
Prediction intervals
A short description of prediction intervals, with an example.
Scatter plots using Plotly
Scatter plots and bubble charts using Plotly for R.

Working with univariate data
Describing and visualizing univariate data in R.

Histograms using Plotly for R
A post on the use of Plotly to create histograms in R

Bar chart using Plotly
Create bar charts using Plotly for R.
Starting with ggplot2
Get going with plotting using ggplot2.
Logistic regression using R
This post describes the principals of multivariate logistic regression using R
Biserial correlation in R
Biserial and point-biserial correlations allows for the calculation of a correlation coefficient if one of the variables is discrete in nature.
Testing assumptions for the use of parametric tests
In this post with R code snippets, I discuss some of the assumptions that must be met for the use of parametric tests